
dash Copy
Postgresql Monitoring with Elasticsearch and PostgreSQL data sources
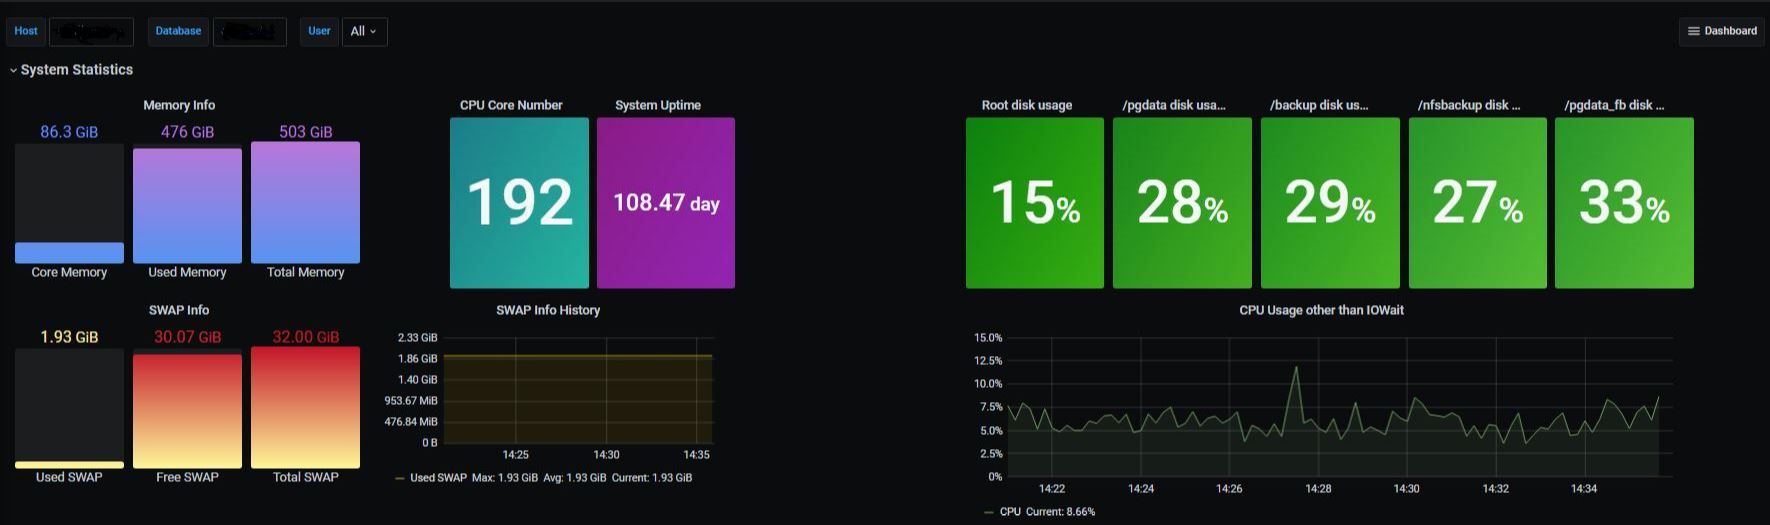
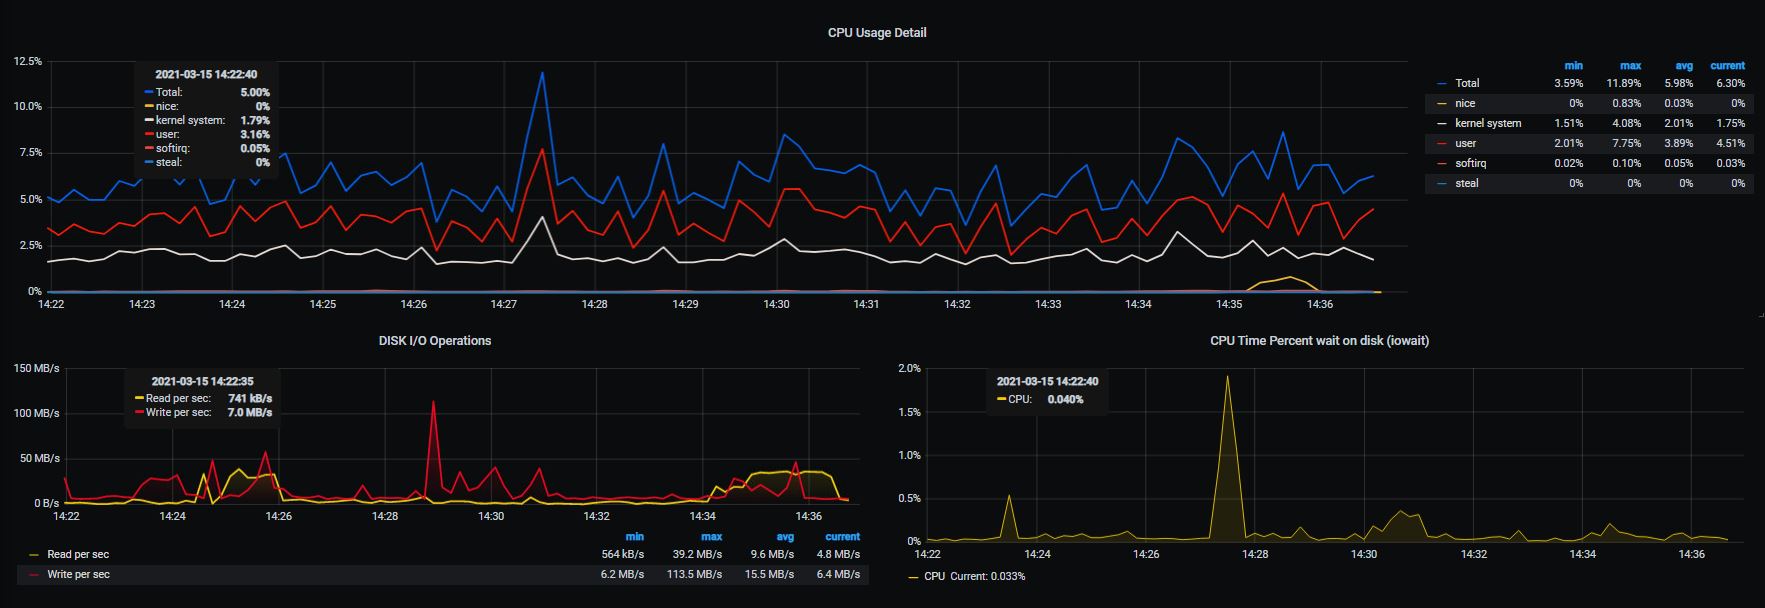
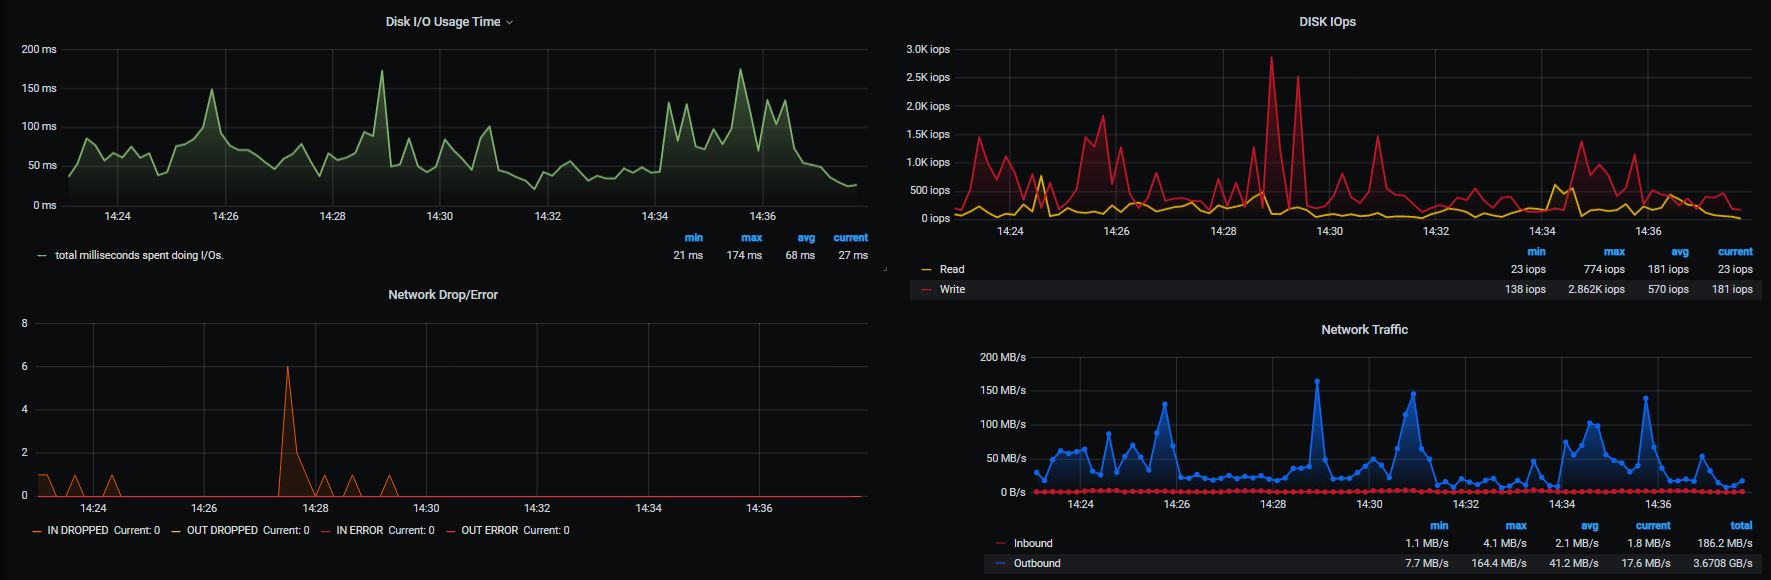
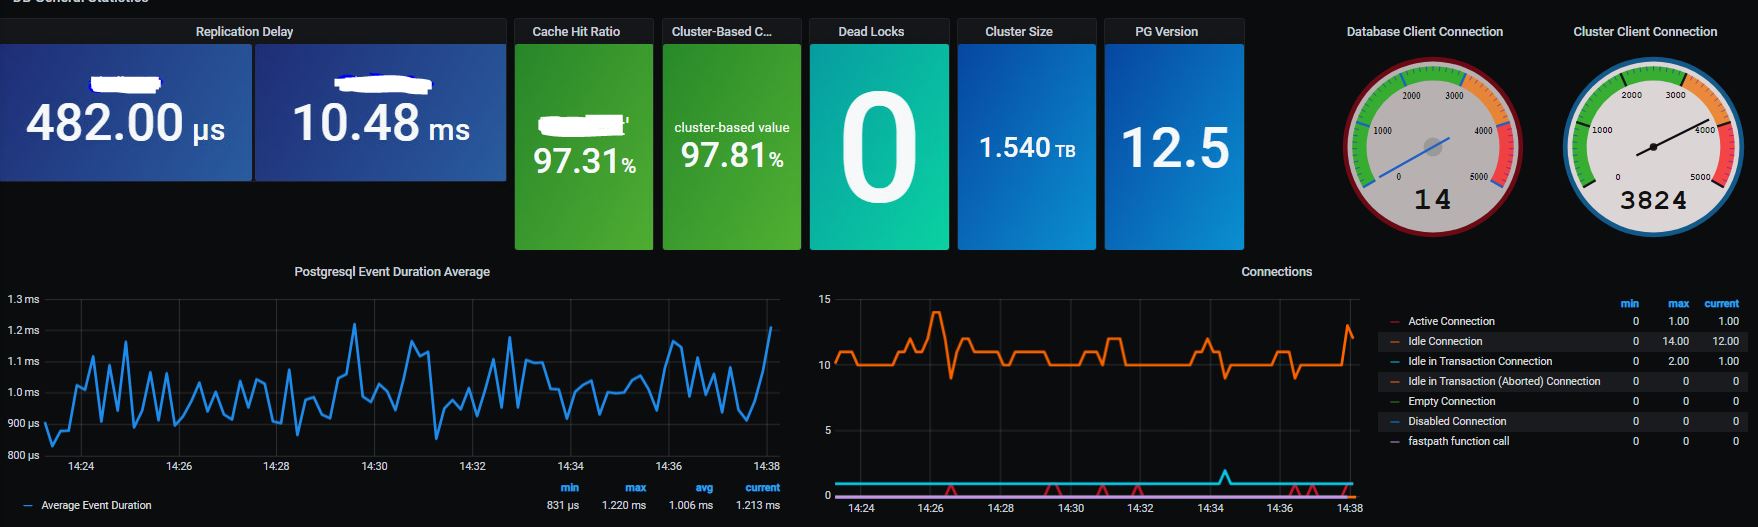
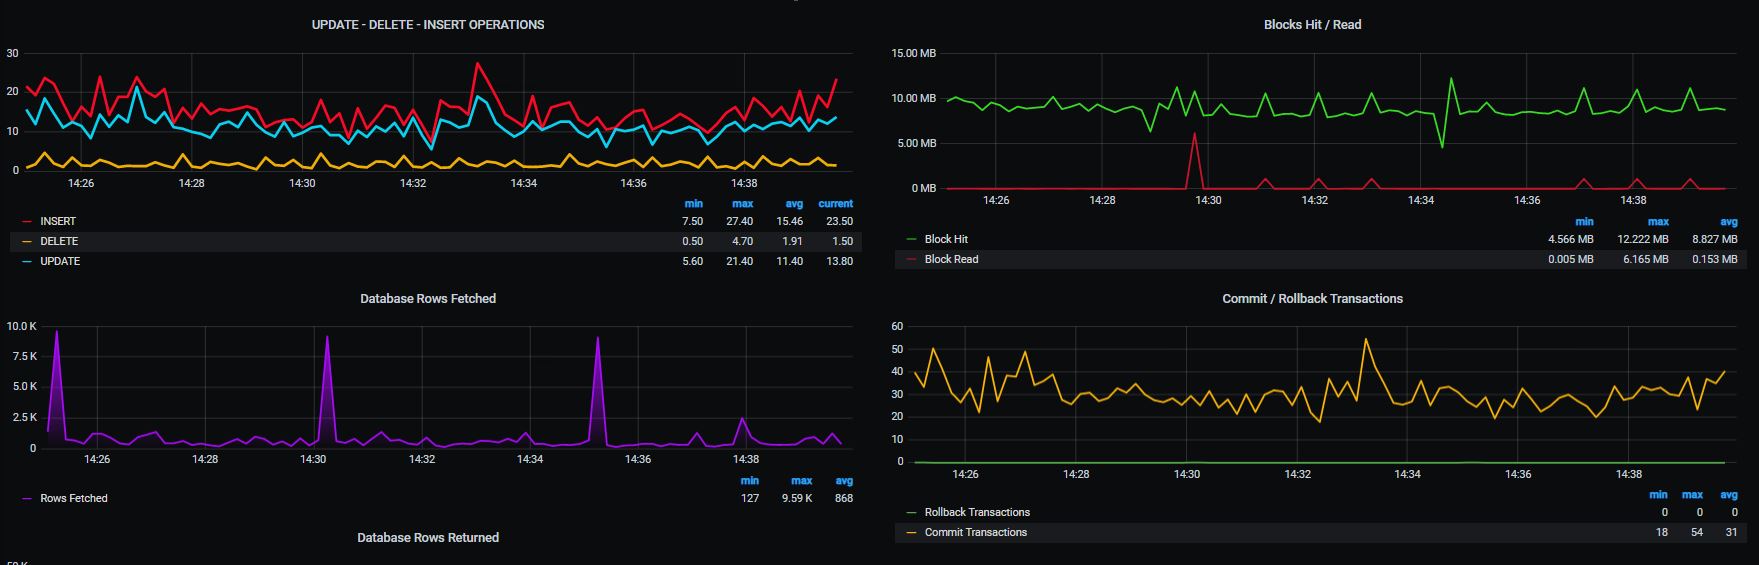
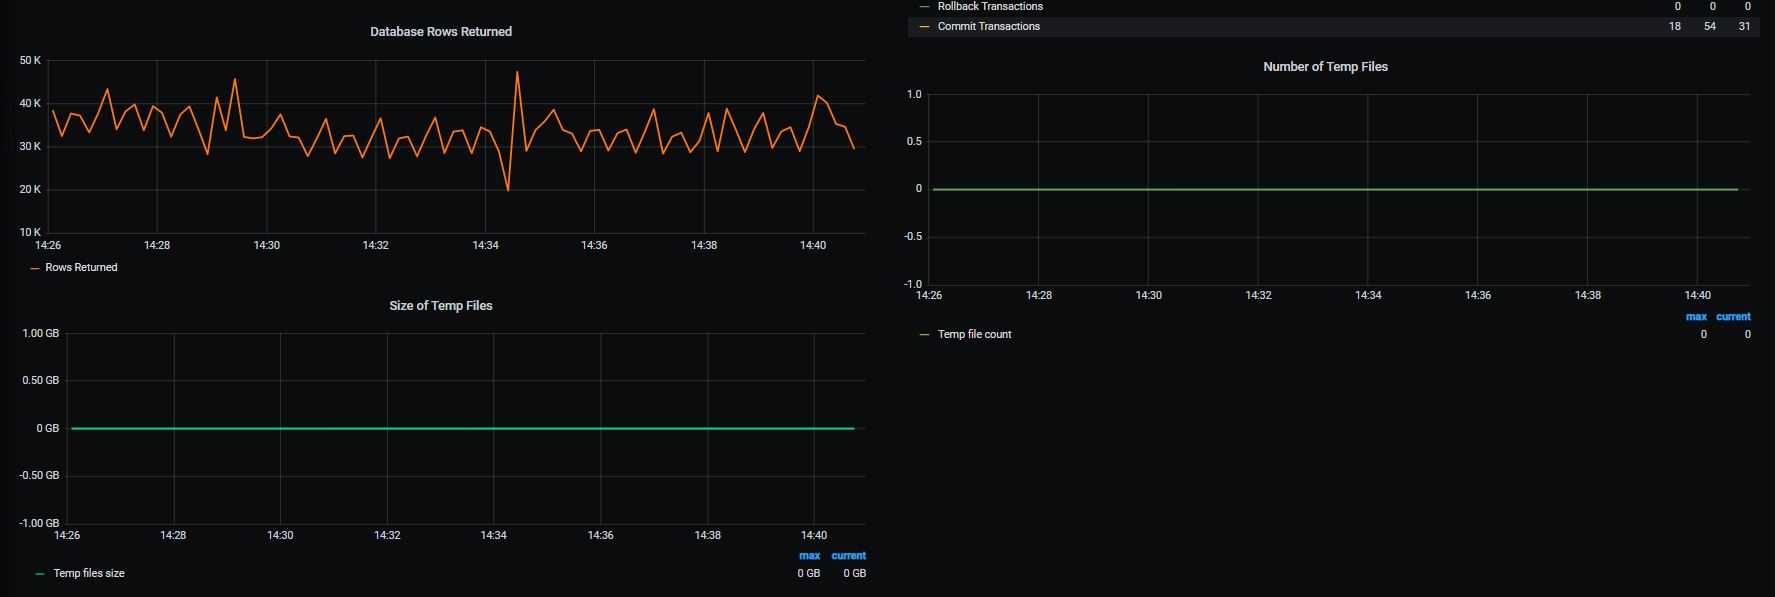
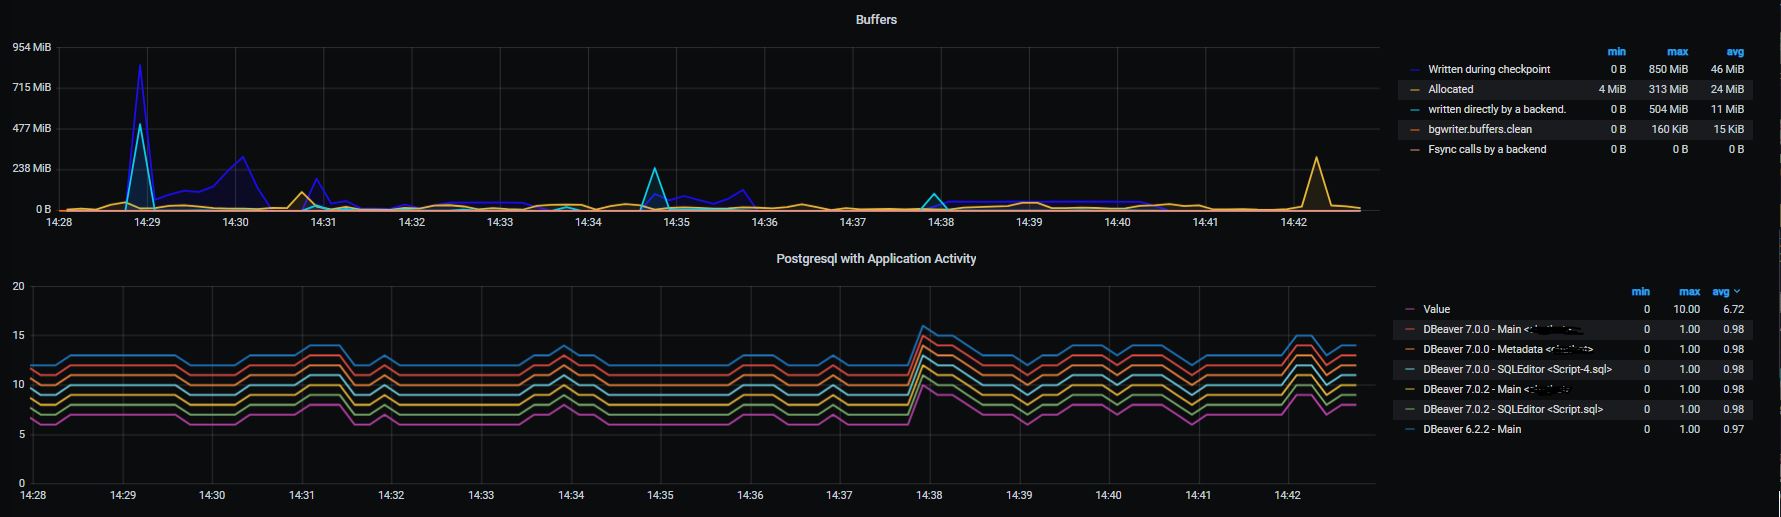
PostgreSQL Database System Monitoring Dashboard with ElasticSearch and PostgreSQL data sources. You can monitor for your system about Disk Statements, CPU, Memory Statements, DB Connections, Buffers, Temp Files, DISK I/O , Network Traffic, and more. Metricbeat v7.x Grafana v6.x
Data source config
Collector type:
Collector plugins:
Collector config:
Revisions
Upload an updated version of an exported dashboard.json file from Grafana
| Revision | Description | Created | |
|---|---|---|---|
| Download |