
Zabbix-MySQL
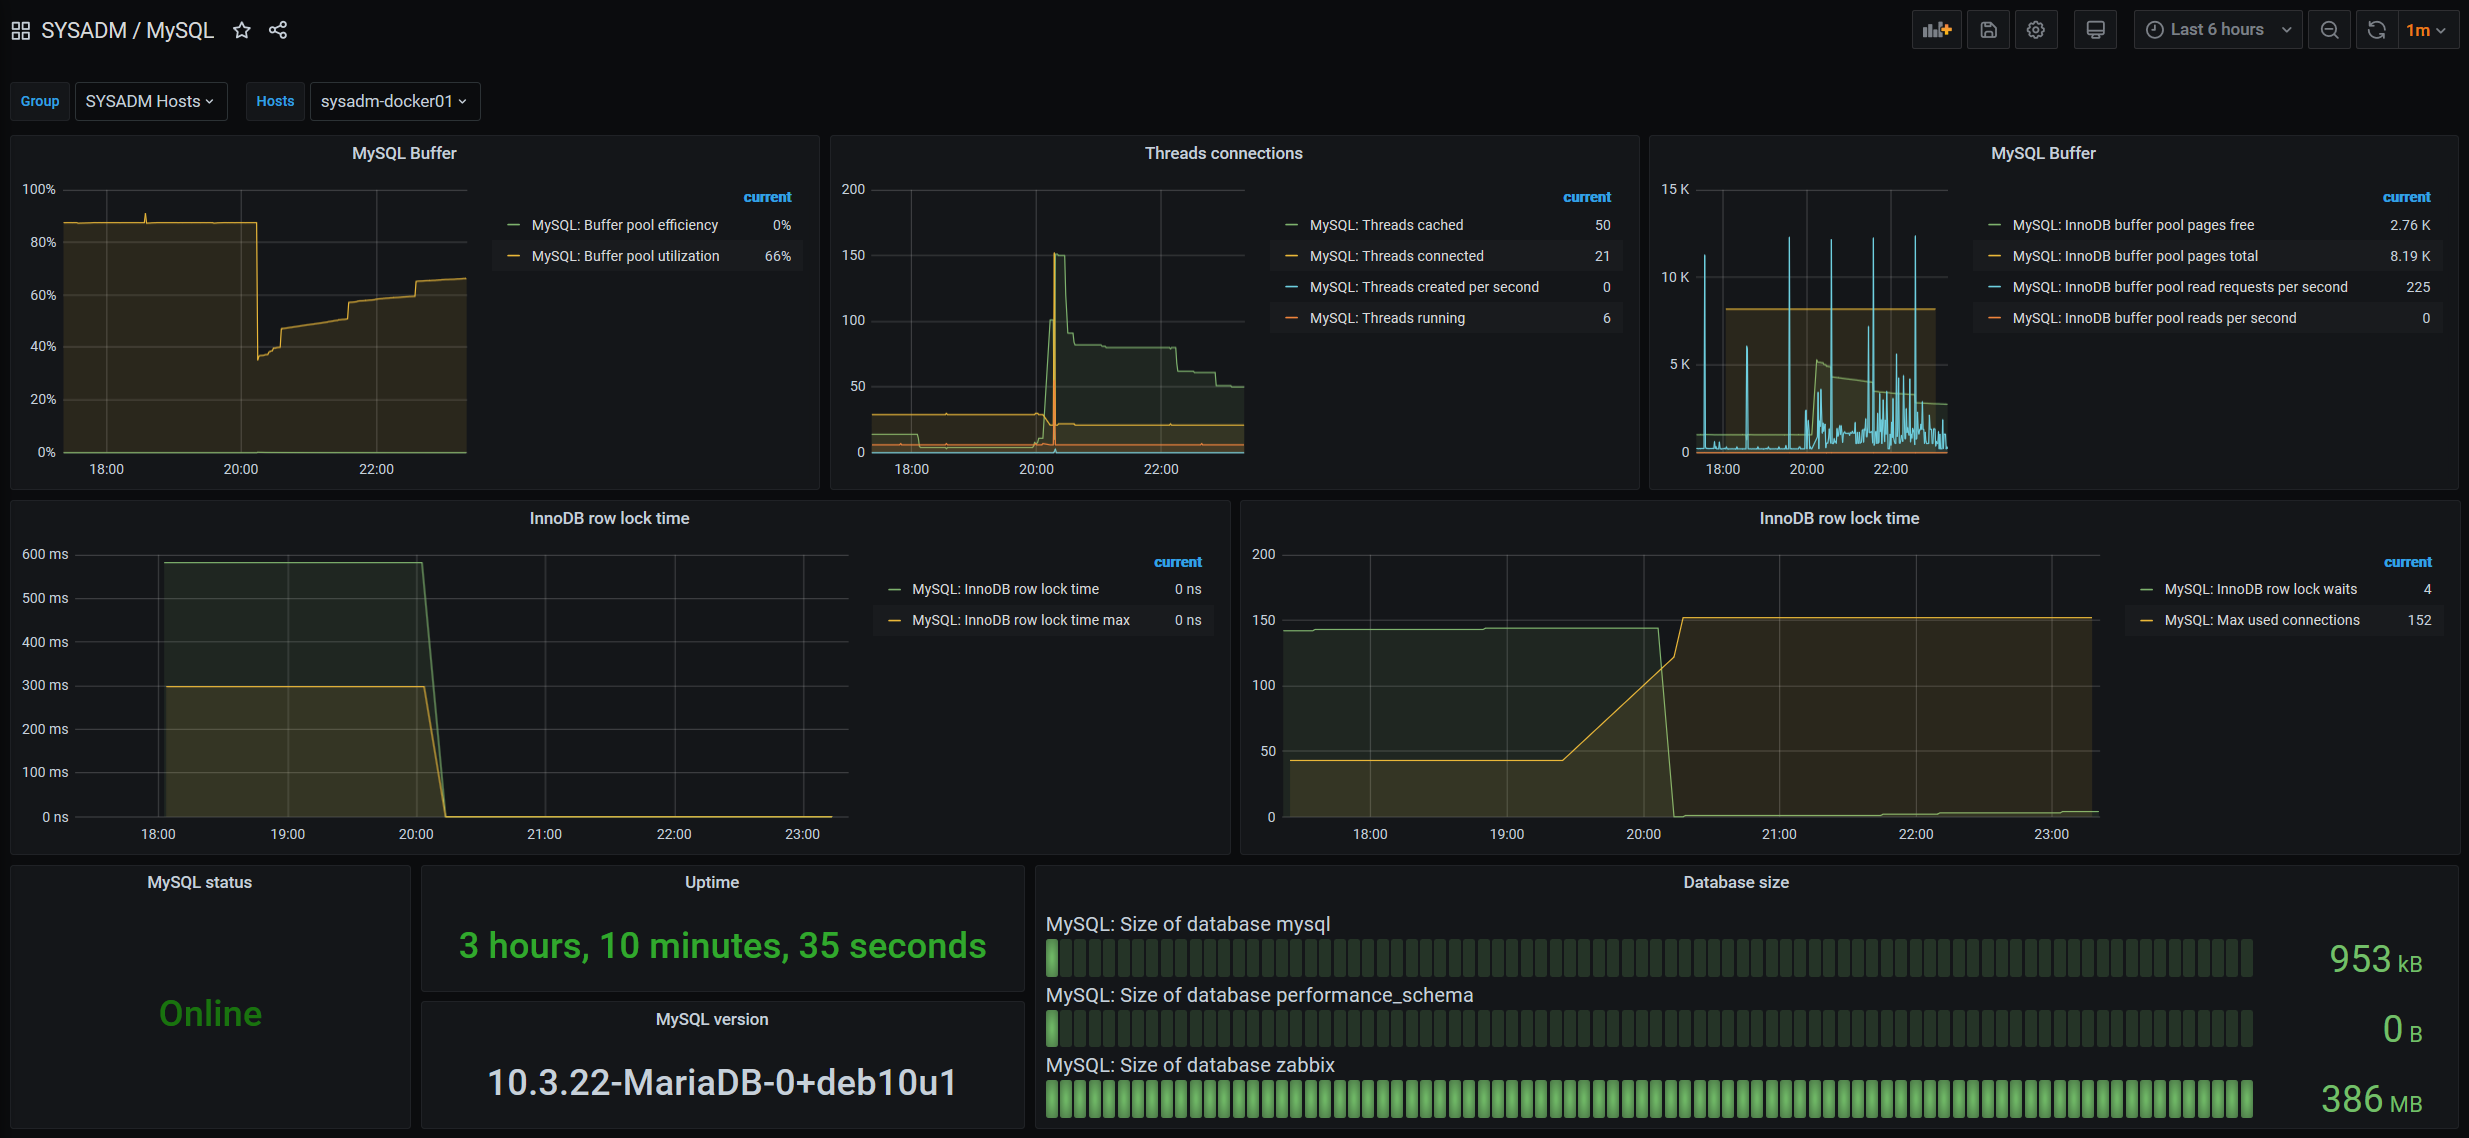
MySQL dashboard ready for works with Zabbix Agent version 2
Features
- Buffer pool metrics
- Threads metrics
- InnoDB lock waits/time
- Max used connections
- Uptime, status, version
- Autodiscovery for database size
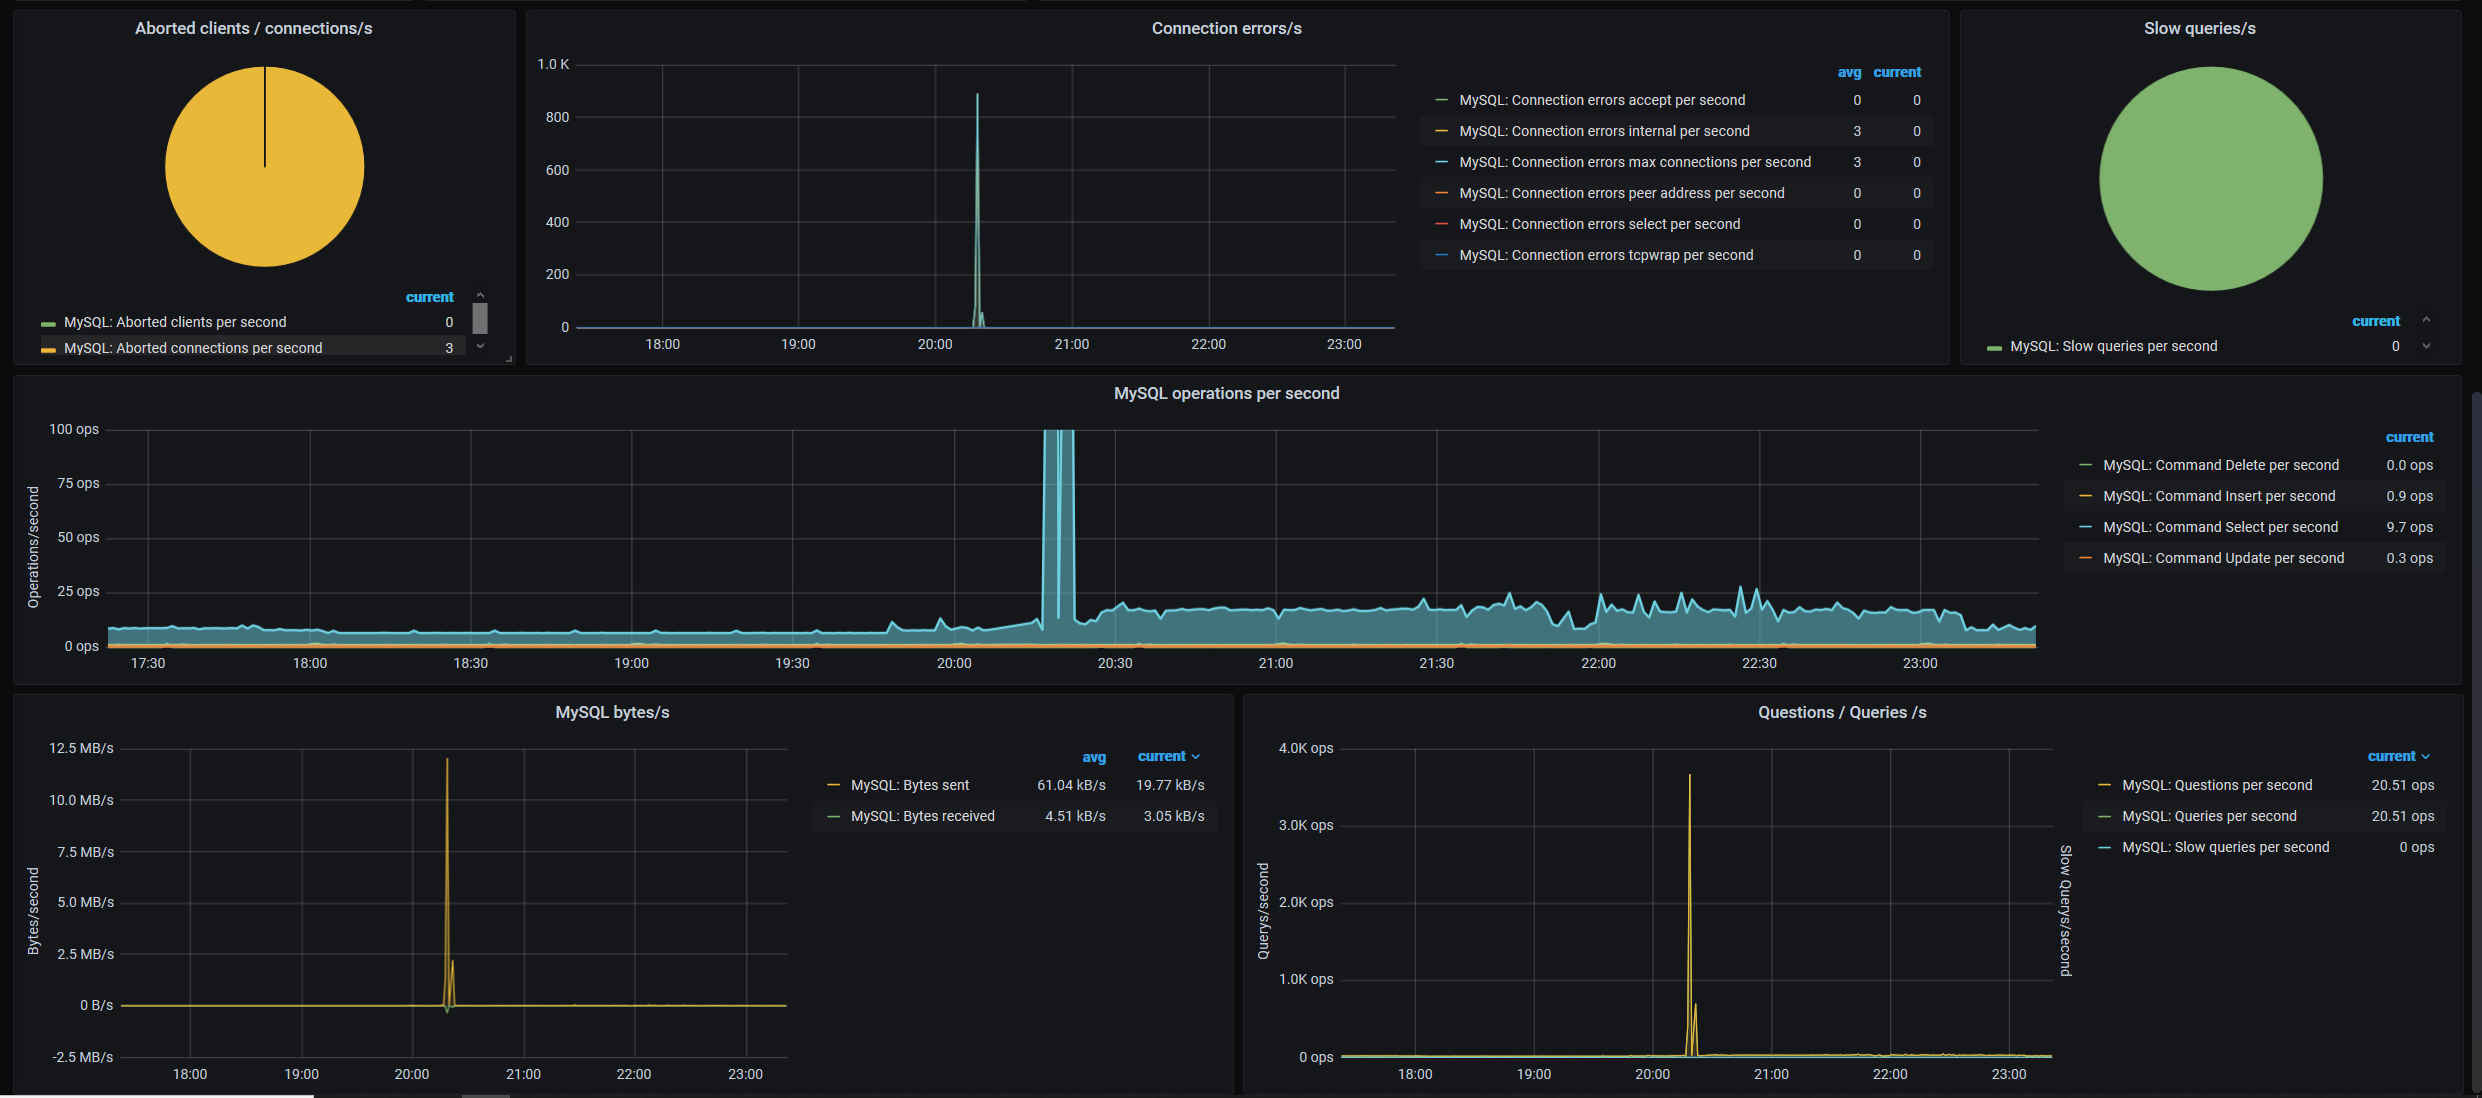
- Aborted connections, slow queries
- Commands operations per second
- Data I/O per second
Requeriments
- Zabbix Agent V2
- Datasource: Zabbix
- At the variable $Group, you must match your group to focus at regex field
- Zabbix Template: https://git.zabbix.com/projects/ZBX/repos/zabbix/browse/templates/db/mysql_agent2/README.md
Support

Data source config
Collector type:
Collector plugins:
Collector config:
Revisions
Upload an updated version of an exported dashboard.json file from Grafana
| Revision | Description | Created | |
|---|---|---|---|
| Download |
MySQL
Monitor MySQL with Grafana. Easily monitor your MySQL deployment with Grafana Cloud's out-of-the-box monitoring solution.
Learn more