
Node Exporter from Agent Integration
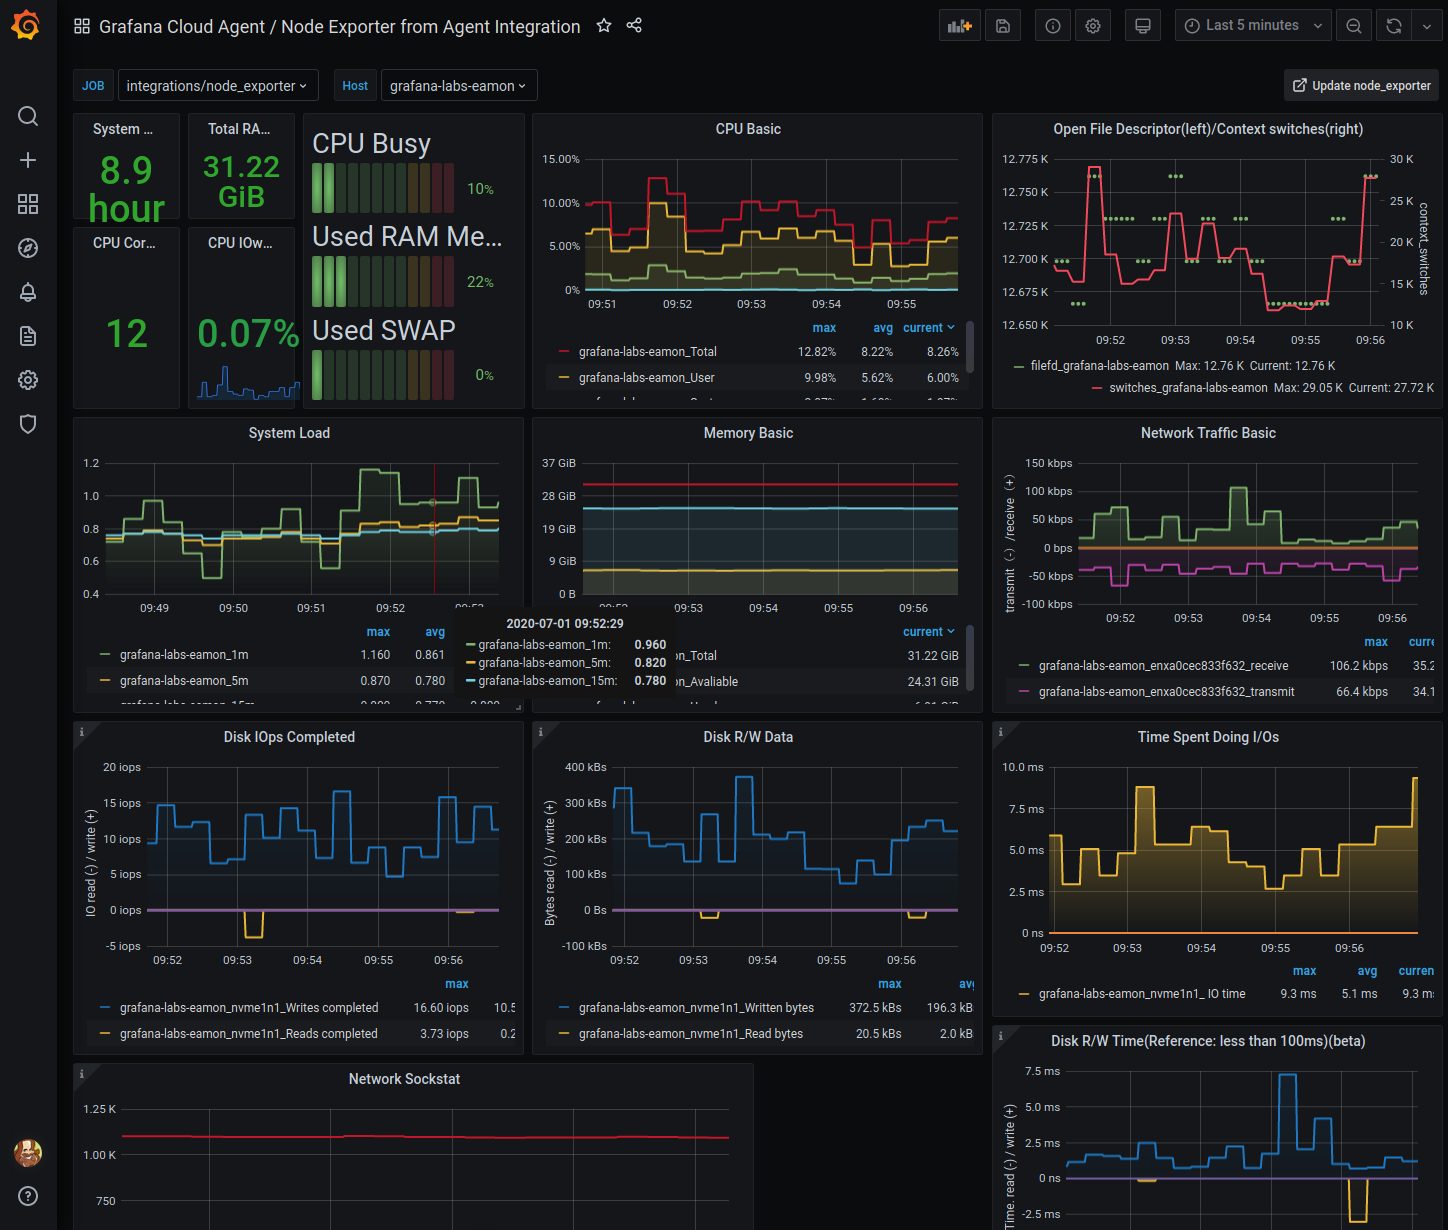
This dashboard will let you visualise node_exporter metrics as sent by the Grafana Cloud Agent - https://github.com/grafana/agent
Sample agent config file:
server:
log_level: info
http_listen_port: 12345
prometheus:
wal_directory: /tmp/wal
global:
scrape_interval: 15s
integrations:
agent:
enabled: true
node_exporter:
enabled: true
Remove the commented out section below and replace REMOTE_WRITE_URL,
REMOTE_WRITE_USERNAME, and REMOTE_WRITE_PASSWORD with the appropriate
values for your specific Grafana Cloud Prometheus instance.
prometheus_remote_write:
- url: https://prometheus-us-central1.grafana.net/api/prom/push
basic_auth:
username: <your-username>
password: <your-password>
Data source config
Collector type:
Collector plugins:
Collector config:
Revisions
Upload an updated version of an exported dashboard.json file from Grafana
| Revision | Description | Created | |
|---|---|---|---|
| Download |
Grafana Agent
Easily monitor metrics and logs from a Grafana Agent instance with Grafana Cloud's out-of-the-box monitoring solution.
Learn more