OpenTelemetry Collector
Provides information about the status of the OpenTelemetry Collector
OpenTelemetry Collector Dashboard
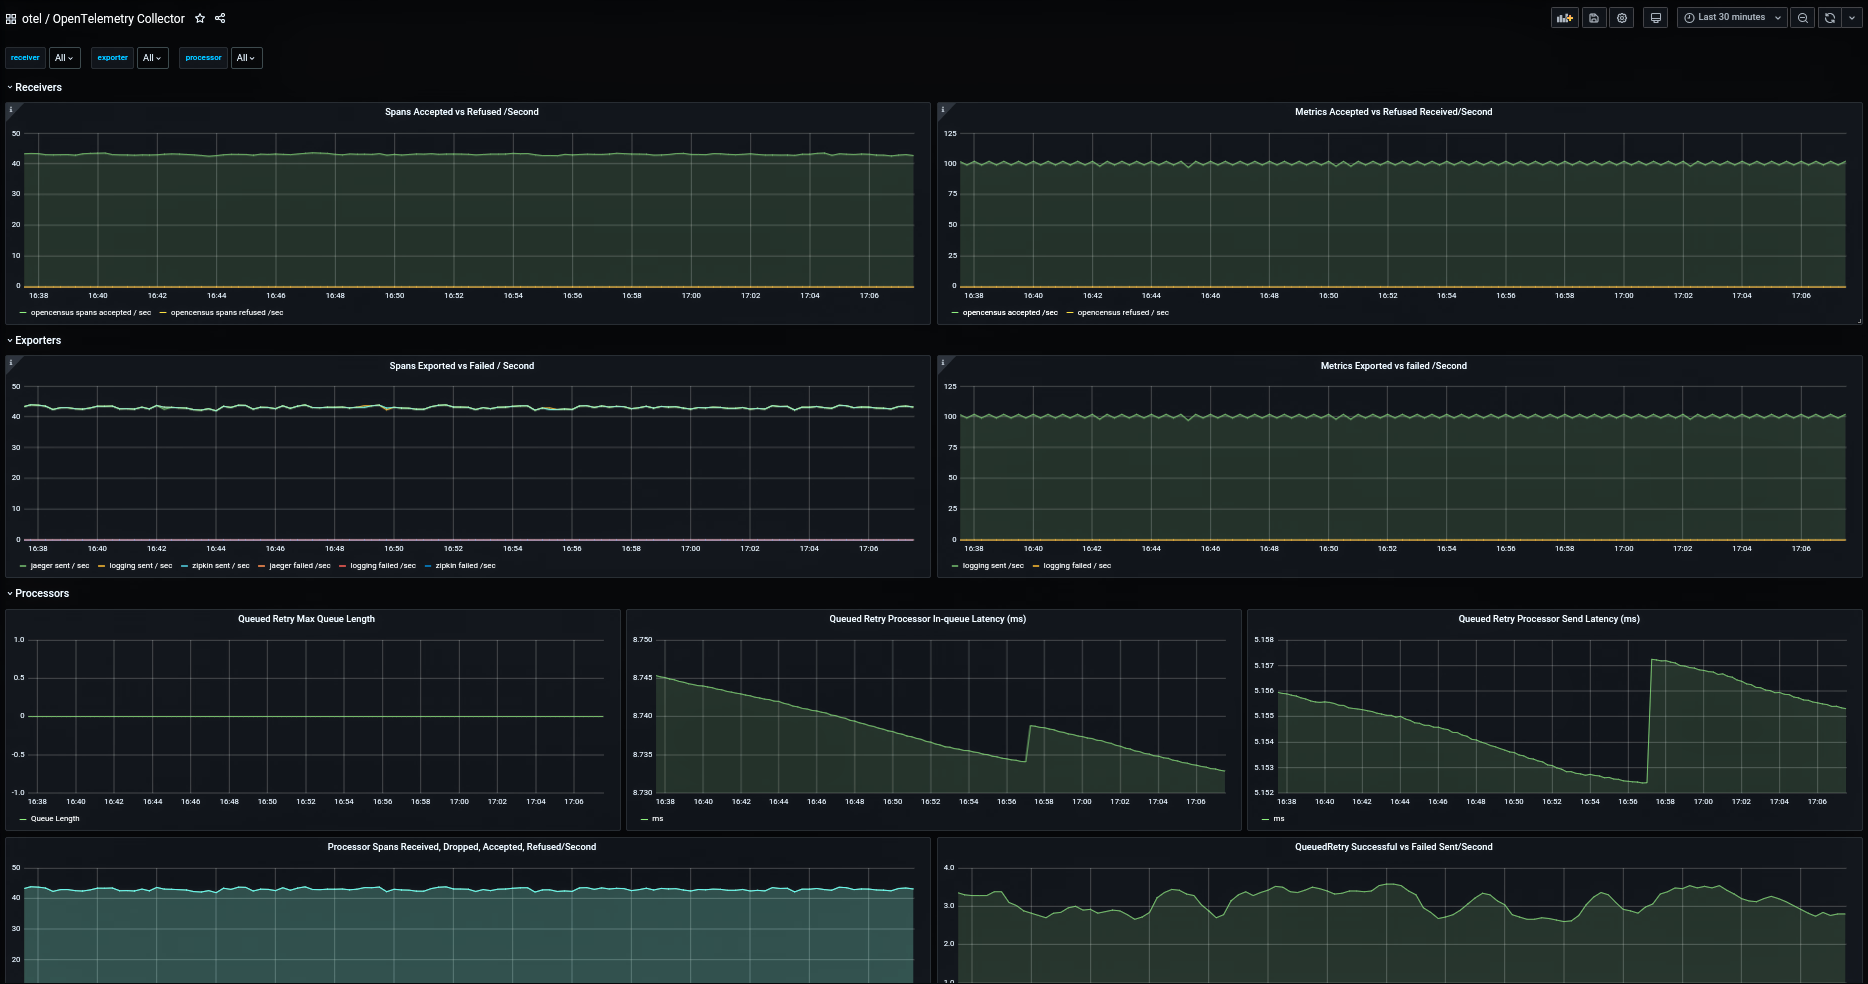
This dashboard displays metrics exposed by the OpenTelemetry collector instance (whether running as an agent or a collector)
This is based on an older OpenTelemetry Collector dashboard by Paulo Janotti with consolidated panels and updated for Grafana 7.0.x
open-telemetry/opentelemetry-collector
It displays metrics on:
- Receivers
- Processors
- Queued Retry
- Batch
- Exporters
Roadmap
- add GRPC metrics section
- add process metrics section with heap and runtime memory metrics
Data source config
Collector config:
Upload an updated version of an exported dashboard.json file from Grafana
| Revision | Description | Created | |
|---|---|---|---|
| Download |

