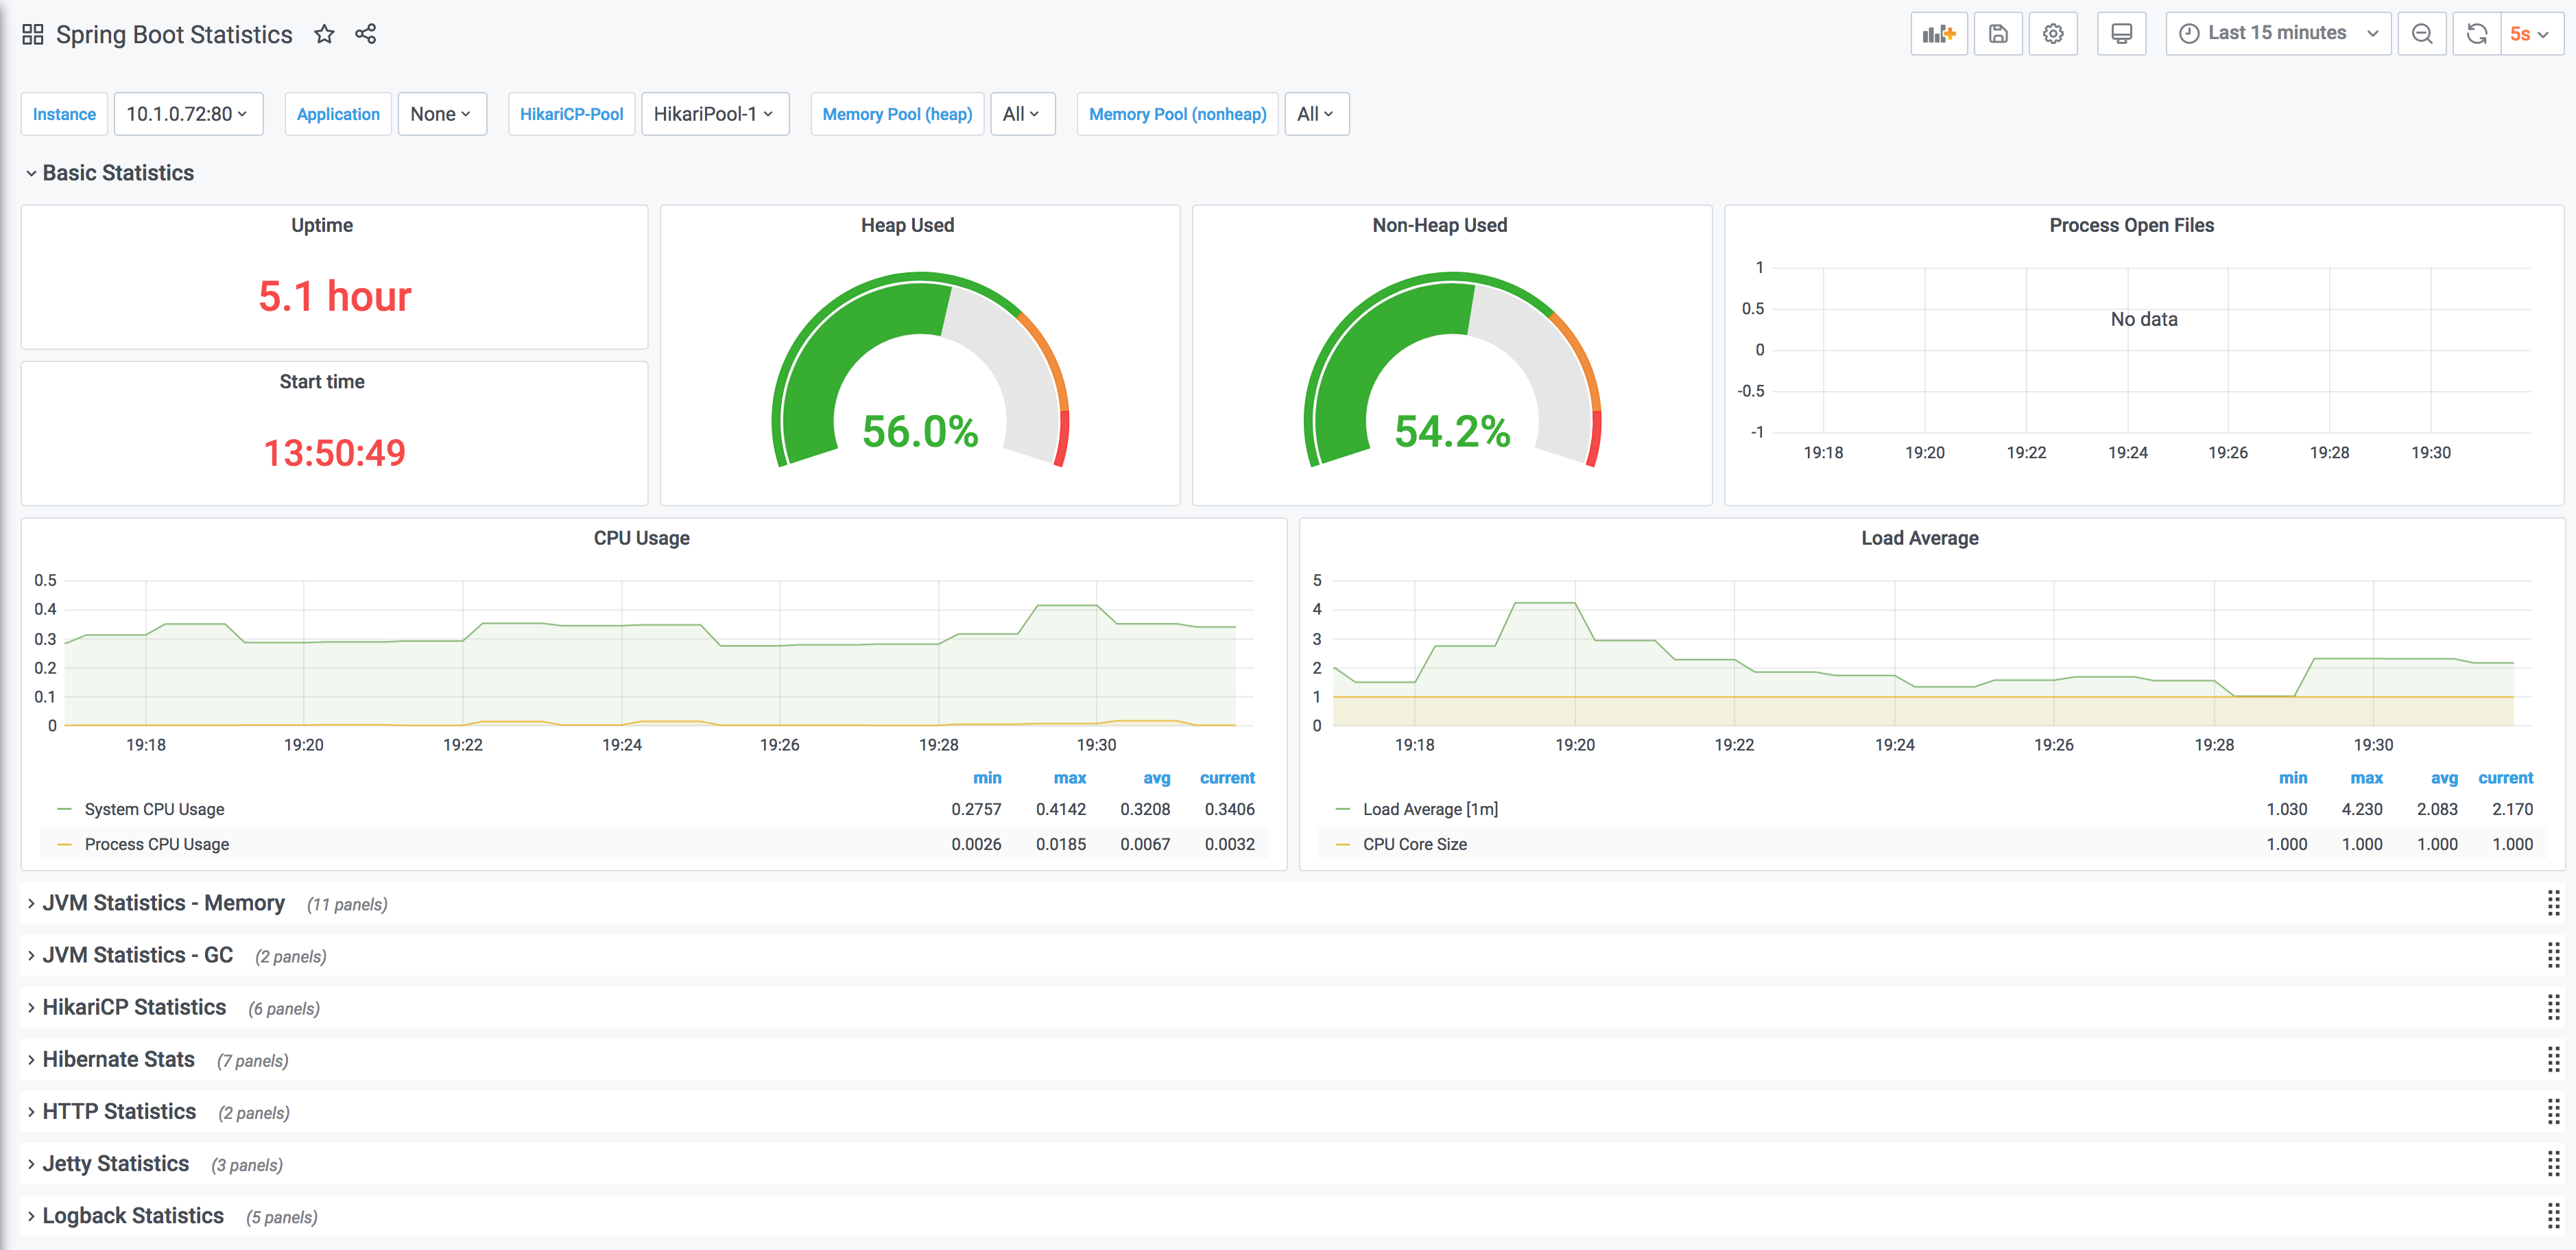
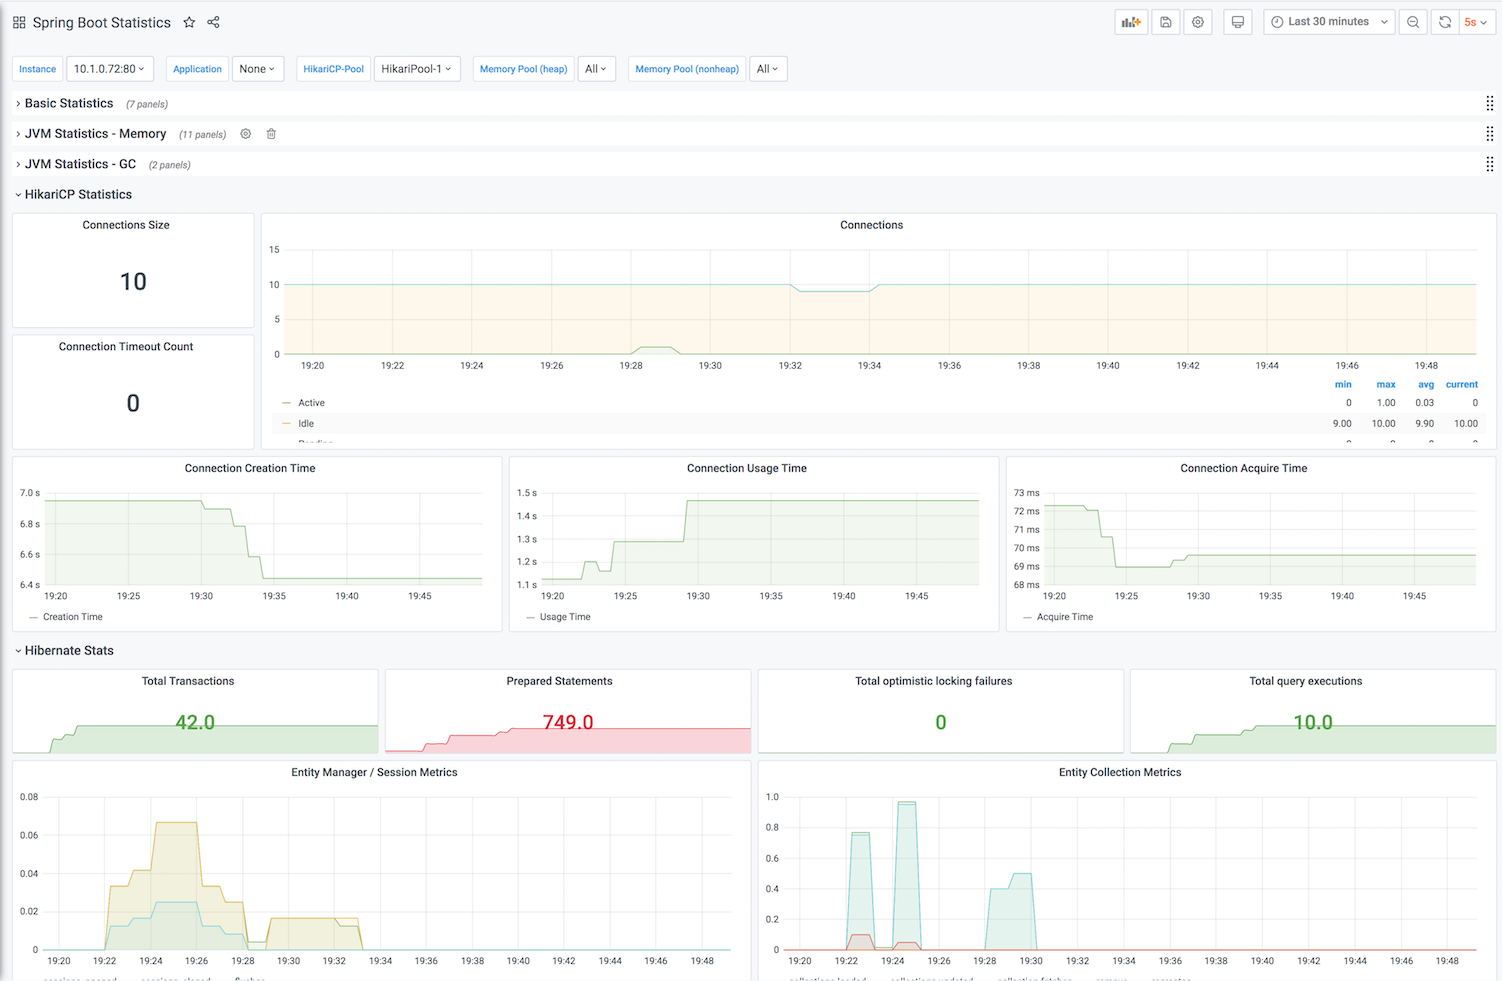
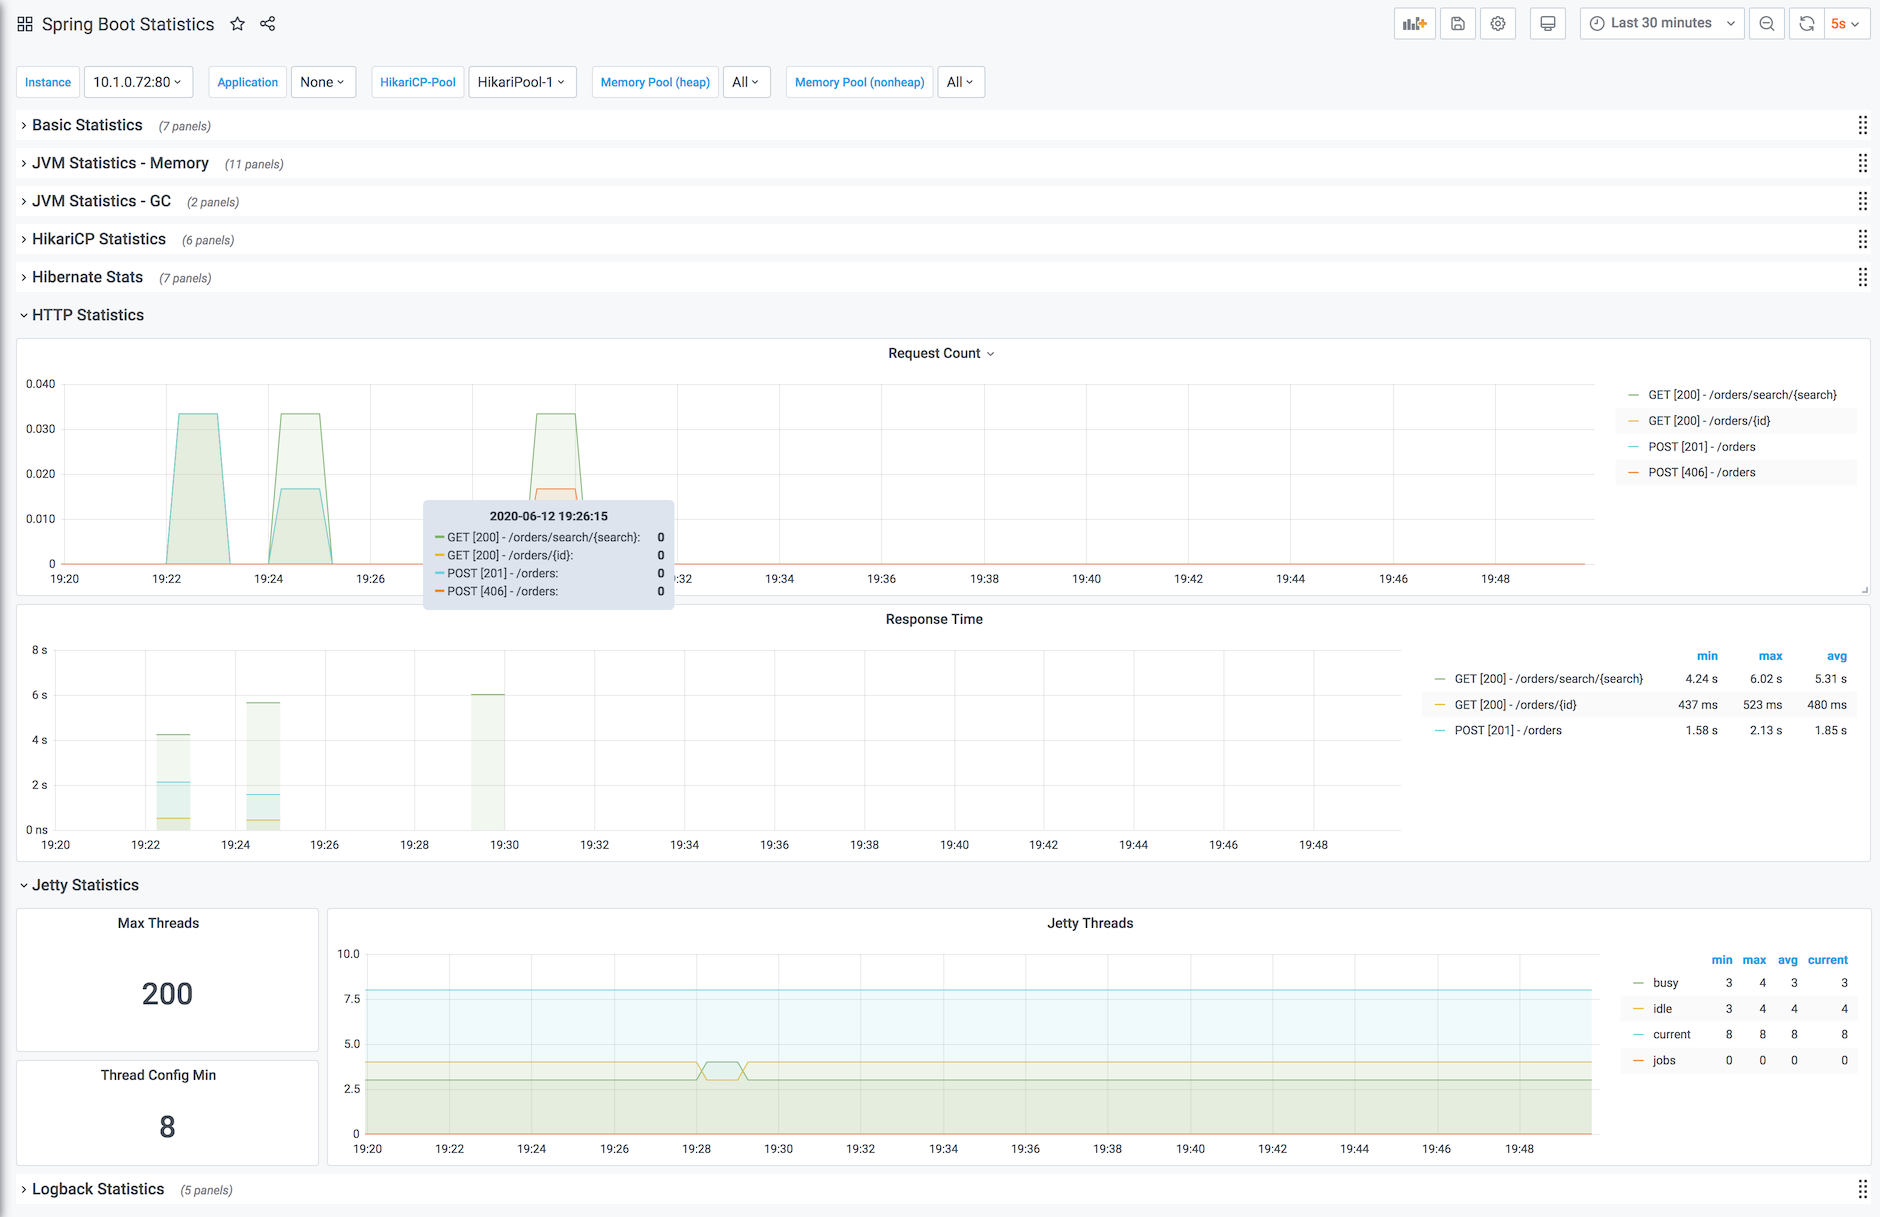
Spring Boot Statistics
Dashboard for Spring Boot2 Statistics(by micrometer-prometheus). This is a fork of dashboard 6756, fixed for Spring Boot 2.3 and support for Jetty instead of Tomcat.
Exporter
This dashboard is setup to work with metrics exposed by Spring Boot actuator using its prometheus endpoint. See documentation on how to enable the actuator endpoints.
If applications are deployed on kubernetes, and Prometheus and Grafana are running on Kubernetes itself, use the deployment annotations to configure Prometheus to scrape the pods. See documentation for instructions on using annotations to configure scraping.
Variables
This dashboard requires the following Variables.
- $instance - Instance Name
- $application - Spring Boot Application Name
- $hikaricp - HikariCP Connection Pool Name
Data source config
Collector config:
Upload an updated version of an exported dashboard.json file from Grafana
| Revision | Description | Created | |
|---|---|---|---|
| Download |
Spring Boot
Easily monitor Spring Boot with Grafana Cloud's out-of-the-box monitoring solution.
Learn more


