Syslog
Telegraf / InfluxDB / Grafana as syslog receiver
Telegraf / InfluxDB / Grafana as syslog receiver
UPDATE 03/2021: Fixed the hostname variable to filter for different syslog sources
UPDATE 03/2021: Message query now uses a text box variable instead of ad-hoc query, which stopped working with Grafana 7.x
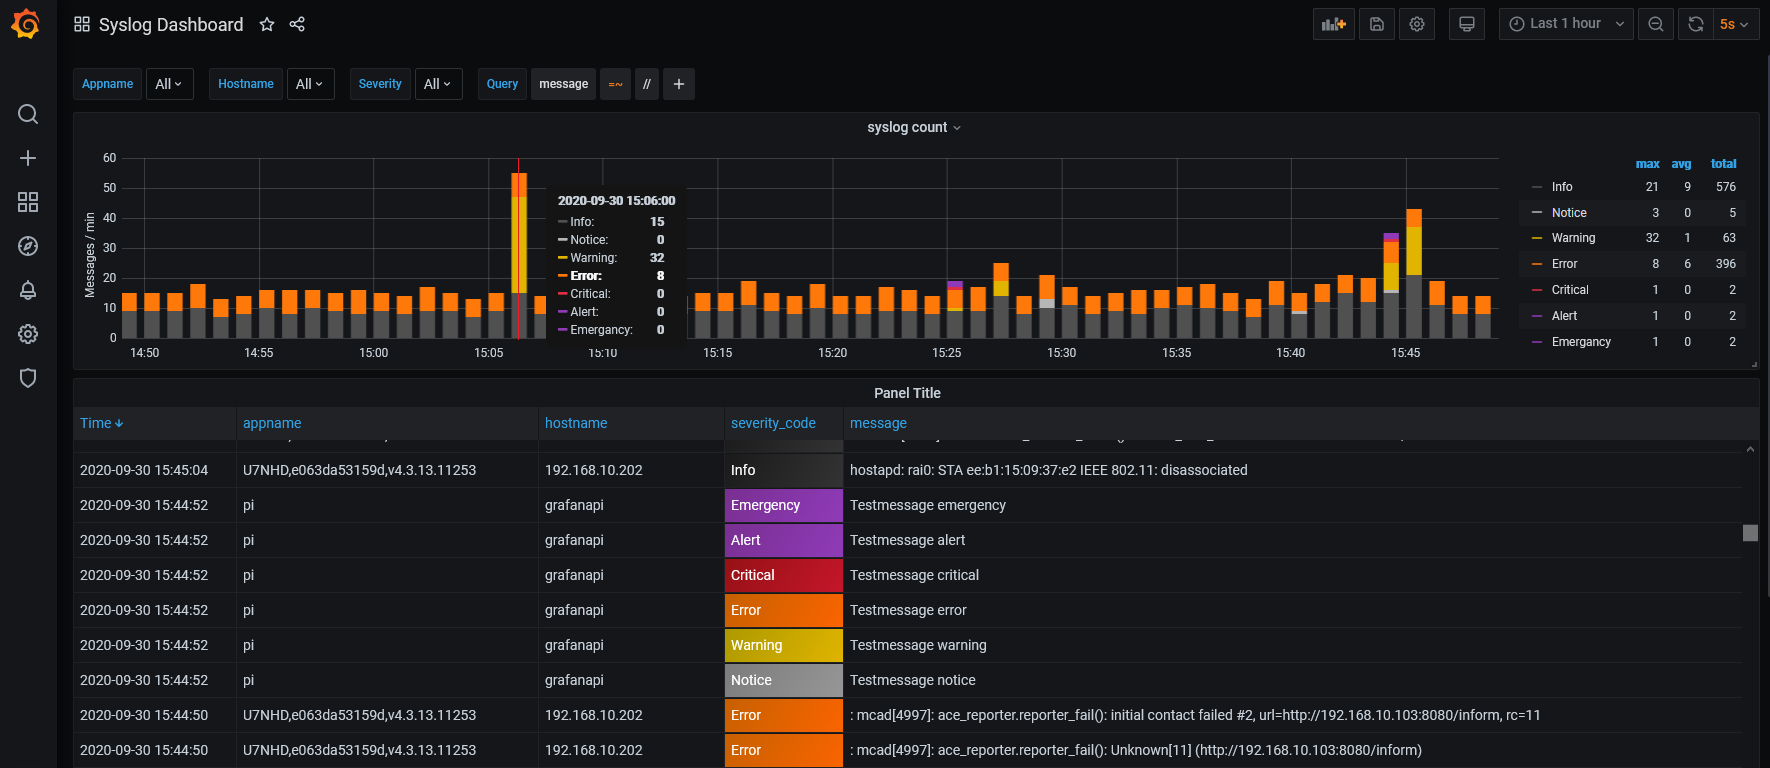
UPDATE 09/2020: Rebuilt the dashboard to take advantage of the new table panel possibilities with Grafana 7.x, e.g. dedicated severity colors.
The Syslog dashboard shows a statistics graph panel at the top, based on the timeframe chosen. Plus a table view of all messages within this timeframe, including the usual columns like message time, appname, host, severity and message text. You can zoom into specific timeframes (syslog peaks or massive errors) by just marking the area by mouse in the graph panel. The table view adjusts accordingly.
It also provides some extra filters based on appname, hostname, severity and message text.
How to store classic UDP/514 syslog in InfluxDB via rsyslog
Because Telegraf only accepts TCP syslog messages in a certain format (RFC5424), the rsyslog daemon is used to receive classic RFC3164 Syslog messages via UDP port 514 and pipe them to the local Telegraf instance. So the first step is to adapt the rsyslog.conf to our needs:
$WorkDirectory /var/spool/rsyslog
$ActionQueueType LinkedList
$ActionQueueFileName srvrfwd
$ActionResumeRetryCount -1
$ActionQueueSaveOnShutdown on
$ModLoad imudp #loads the udp module
$UDPServerAddress localhost
$UDPServerRun 514
*.* @@(o)127.0.0.1:6514;RSYSLOG_SyslogProtocol23Format
If you would like to filter between local and external syslog messages, there is the possibility of very sophisticated rulesets, for example:
:hostname, contains, "grafanapi"
*.notice @@(o)127.0.0.1:6514;RSYSLOG_SyslogProtocol23Format
:hostname, !contains, "grafanapi"
*.* @@(o)127.0.0.1:6514;RSYSLOG_SyslogProtocol23Format
Local logging messages are only forwarded when the severity level is equal or greater then notice. External Syslog messages (hostname != grafanapi) will be forwarded to Telegraf regardless of the severity level.
Visit my blog post over at NWMichl Blog for full documentation and a syslog-ng alternative.
Data source config
Collector config:
Upload an updated version of an exported dashboard.json file from Grafana
| Revision | Description | Created | |
|---|---|---|---|
| Download |

