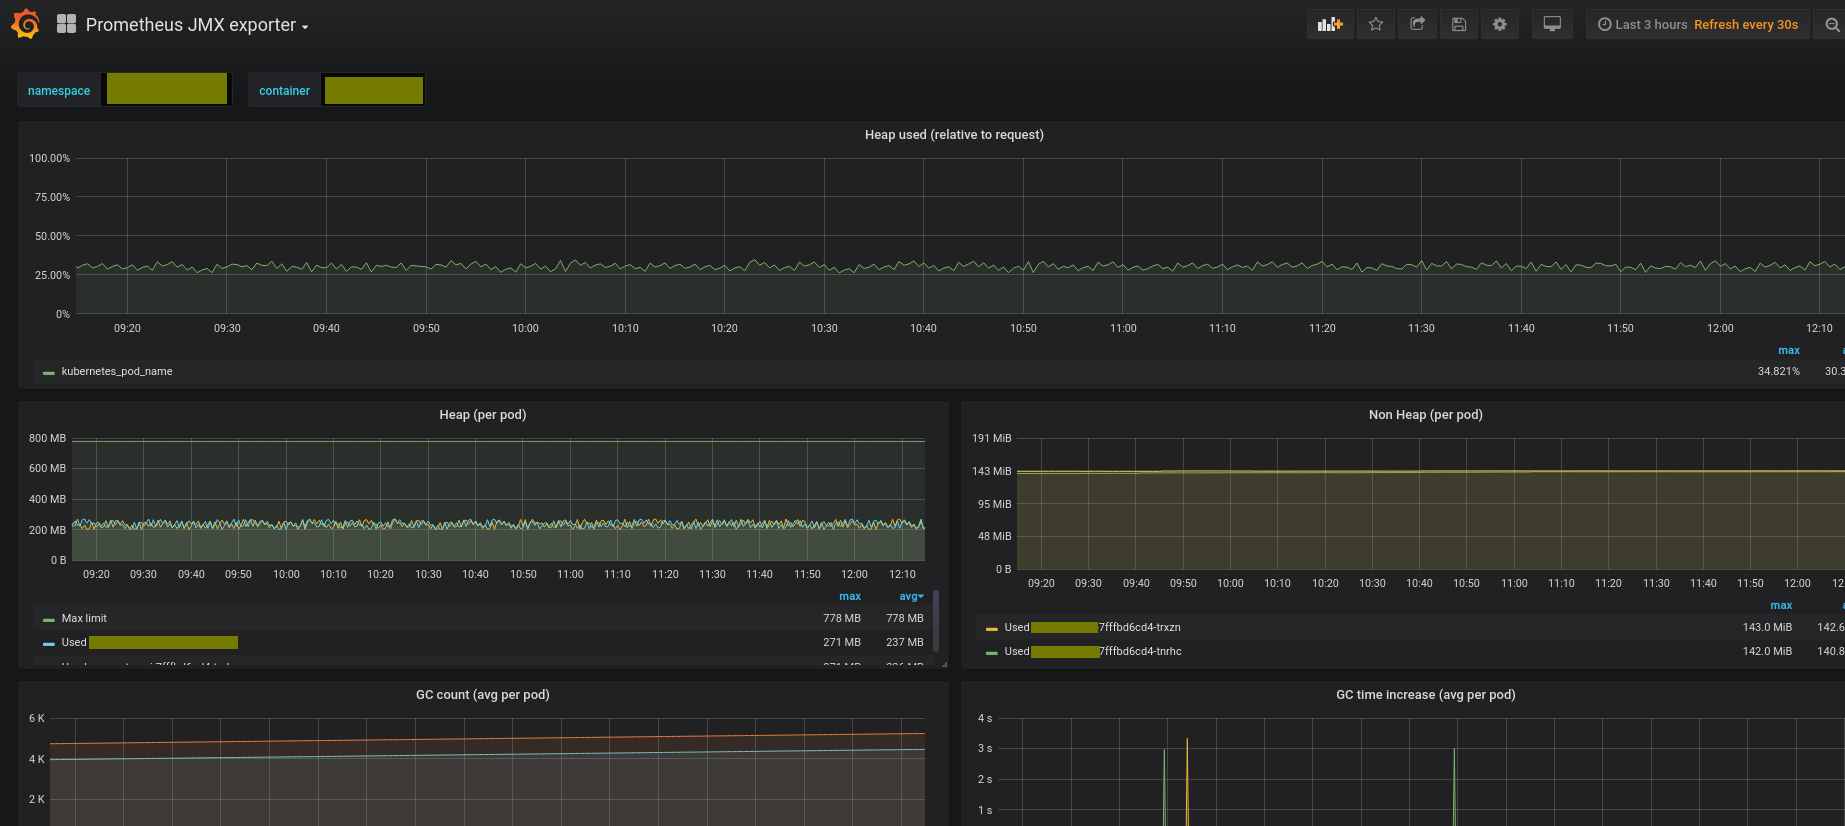
Prometheus JMX exporter for Kubernetes
After selecting your namespace and container you get a wealth of JVM based metrics
Based on: https://grafana.com/grafana/dashboards/1471 and https://grafana.com/grafana/dashboards/9544
Sample YAML for Prometheus agent used: https://github.com/prometheus/jmx_exporter/blob/master/example_configs/httpserver_sample_config.yml
Data source config
Collector config:
Upload an updated version of an exported dashboard.json file from Grafana
| Revision | Description | Created | |
|---|---|---|---|
| Download |
Kubernetes
Monitor your Kubernetes deployment with prebuilt visualizations that allow you to drill down from a high-level cluster overview to pod-specific details in minutes.
Learn more

