
APC UPS (SNMP)
Displays monitoring data collected from APC uninterruptible power supplies via SNMP.
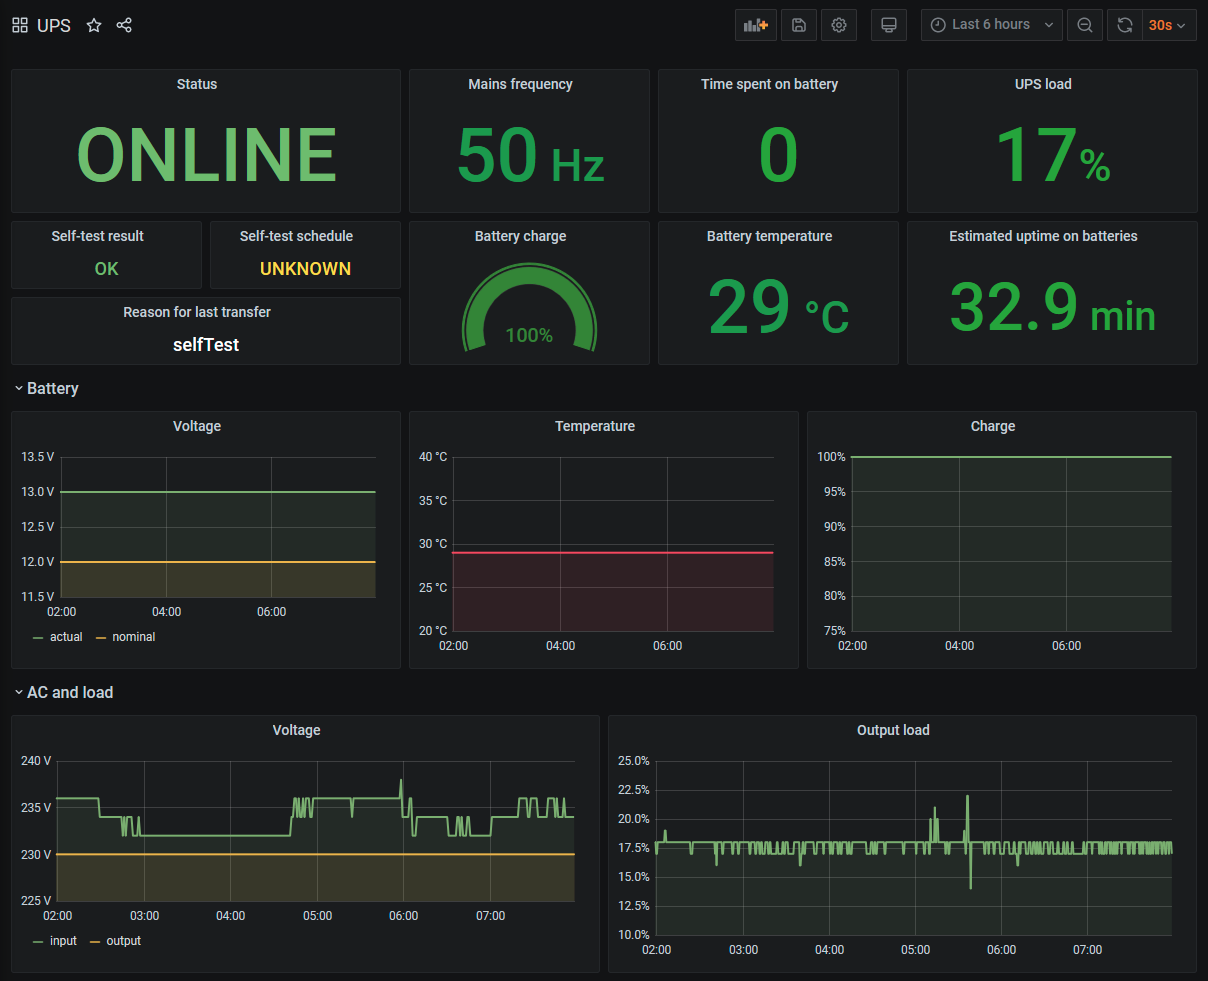
This dashboard consumes data collected by a SNMP daemon using apcupsd-snmp, which is made available to Prometheus by the Prometheus SNMP exporter. My data flow is UPS -> USB -> Linux box -> apcupsd -> snmpd -> Prometheus SNMP exporter -> Prometheus -> Grafana. The name of the metrics generated by the exporter typically match the Powernet MIB.
Data source config
Collector type:
Collector plugins:
Collector config:
Revisions
Upload an updated version of an exported dashboard.json file from Grafana
| Revision | Description | Created | |
|---|---|---|---|
| Download |