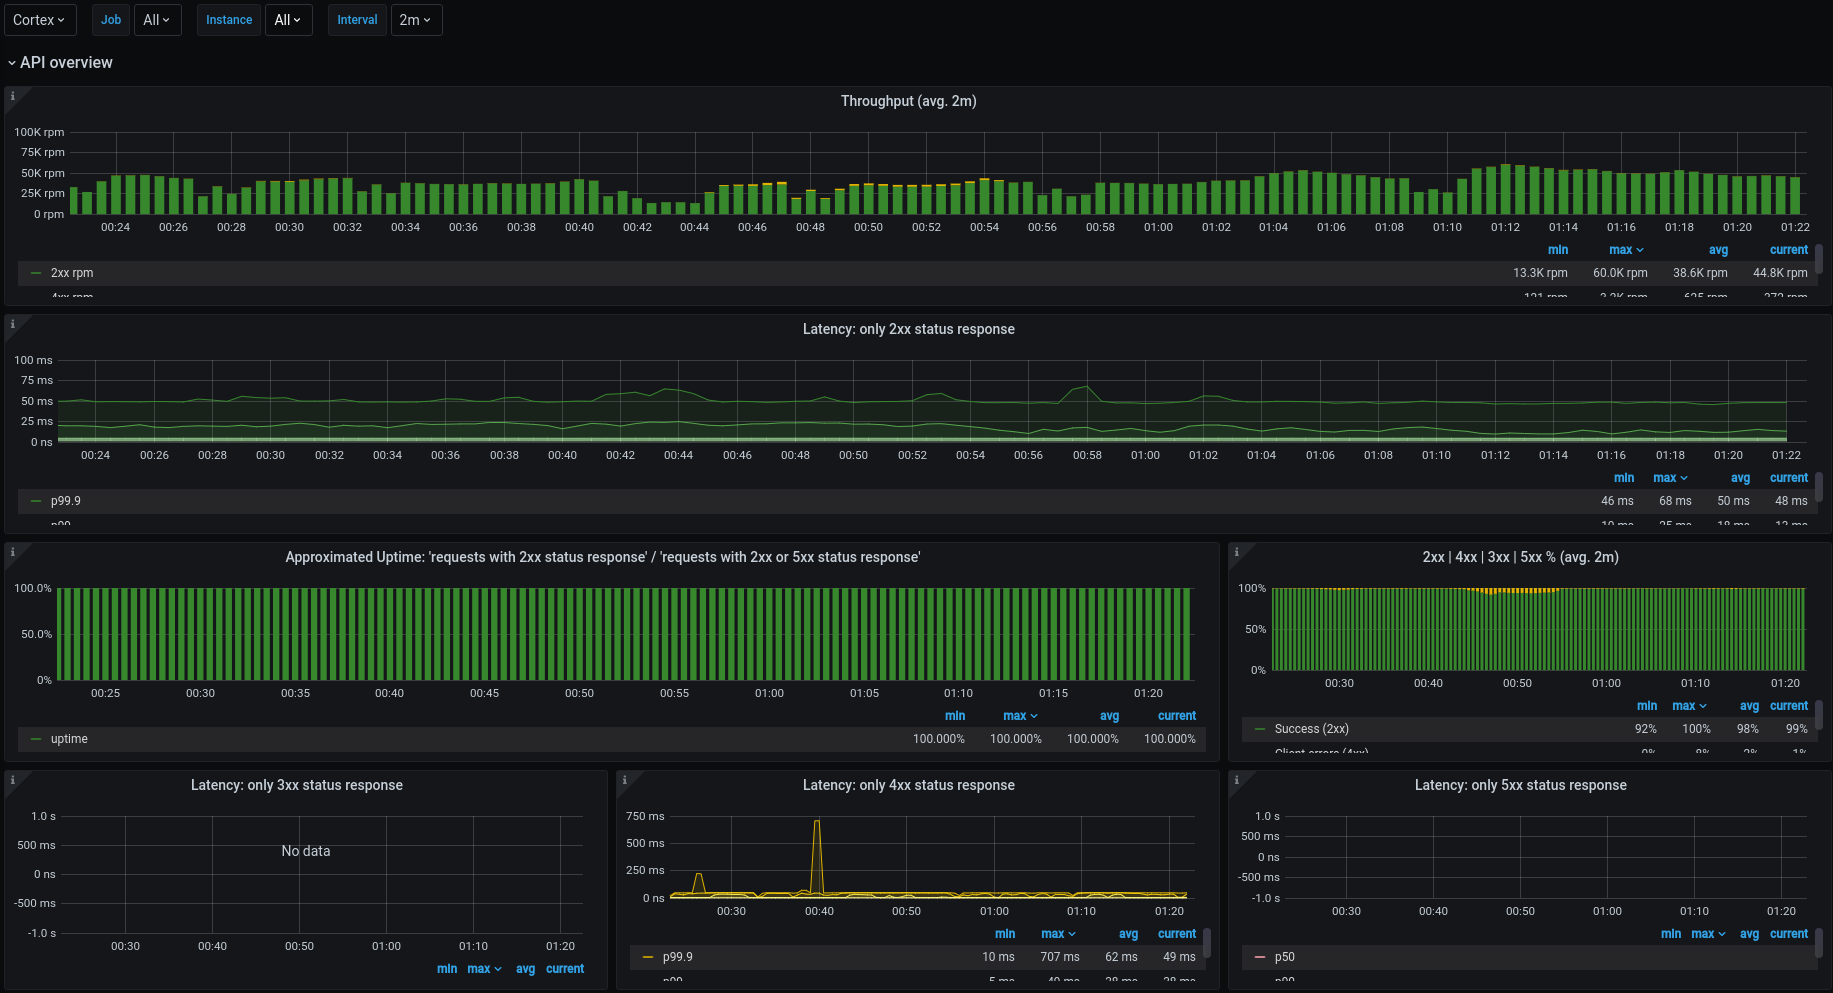
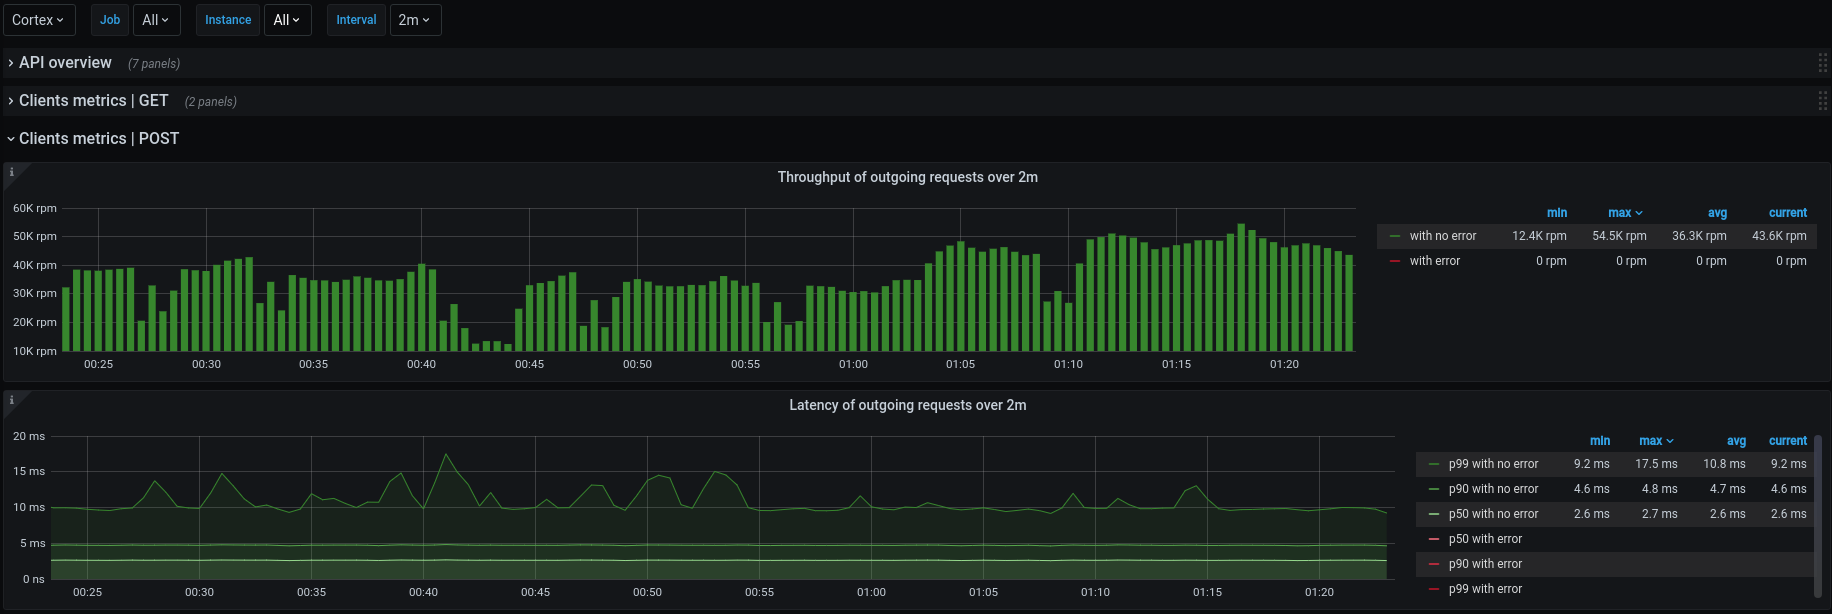
Kamon 2.x - API dashboard
API dashboard for apps instrumented with Kamon 2.x
This dashboard shows metrics for both the server and client side.
The dashboard brings the following variables:
PROMETHEUS_DS: available Prometheus datasources.job: Prometheus jobs with Kamon instrumentation. Multiple selections is enabled.instance: Prometheus instances belonging to the selected jobs.interval: interval time to use in the queries: 30s, 1m, 2m, 5m, 10m, 30m, 1h, 6h, 12h, 1d, 7d, 14d, 30d.
Jobs and instances are in Prometheus terms.
What's included:
The following sections:
- API overview: throughput and latency for server side by status.
- Client metrics: throughput and latency for client side. One row for each operation.
Almost all metrics have a description.
What's required:
It requires the apps to be instrumented with Kamon 2.x and any module with instrumentation for server and client side, such as kamon-akka-http and kamon-play.
How to install:
It requires an action at the first time is imported: specify a properly value for the hidden variable app_filter in order to be able to list the jobs with kamon instrumentation properly.
An example:
Suppose you have the apps app-1, app-2 and app-3 instrumented with Kamon and they are scrapped by Prometheus using jobs with the same names, so there have to be the jobs app-1, app-2 and app-3 on Prometheus. In this case, a good value for the custom variable app_filter would be app-1.*|app-2.*|app-3.*. Take in account that this value will be used to load the query variable job whose query expression is label_values(up{job=~"$app_filter"}, job).
Issues / questions
Feedback is always welcome!
For issues and questions please go to the repo cspinetta/kamon-grafana-dashboards.
Data source config
Collector config:
Upload an updated version of an exported dashboard.json file from Grafana
| Revision | Description | Created | |
|---|---|---|---|
| Download |


