
Raspberry Pi Temperature
Grafana dasborad designed for Raspberry pi Systems
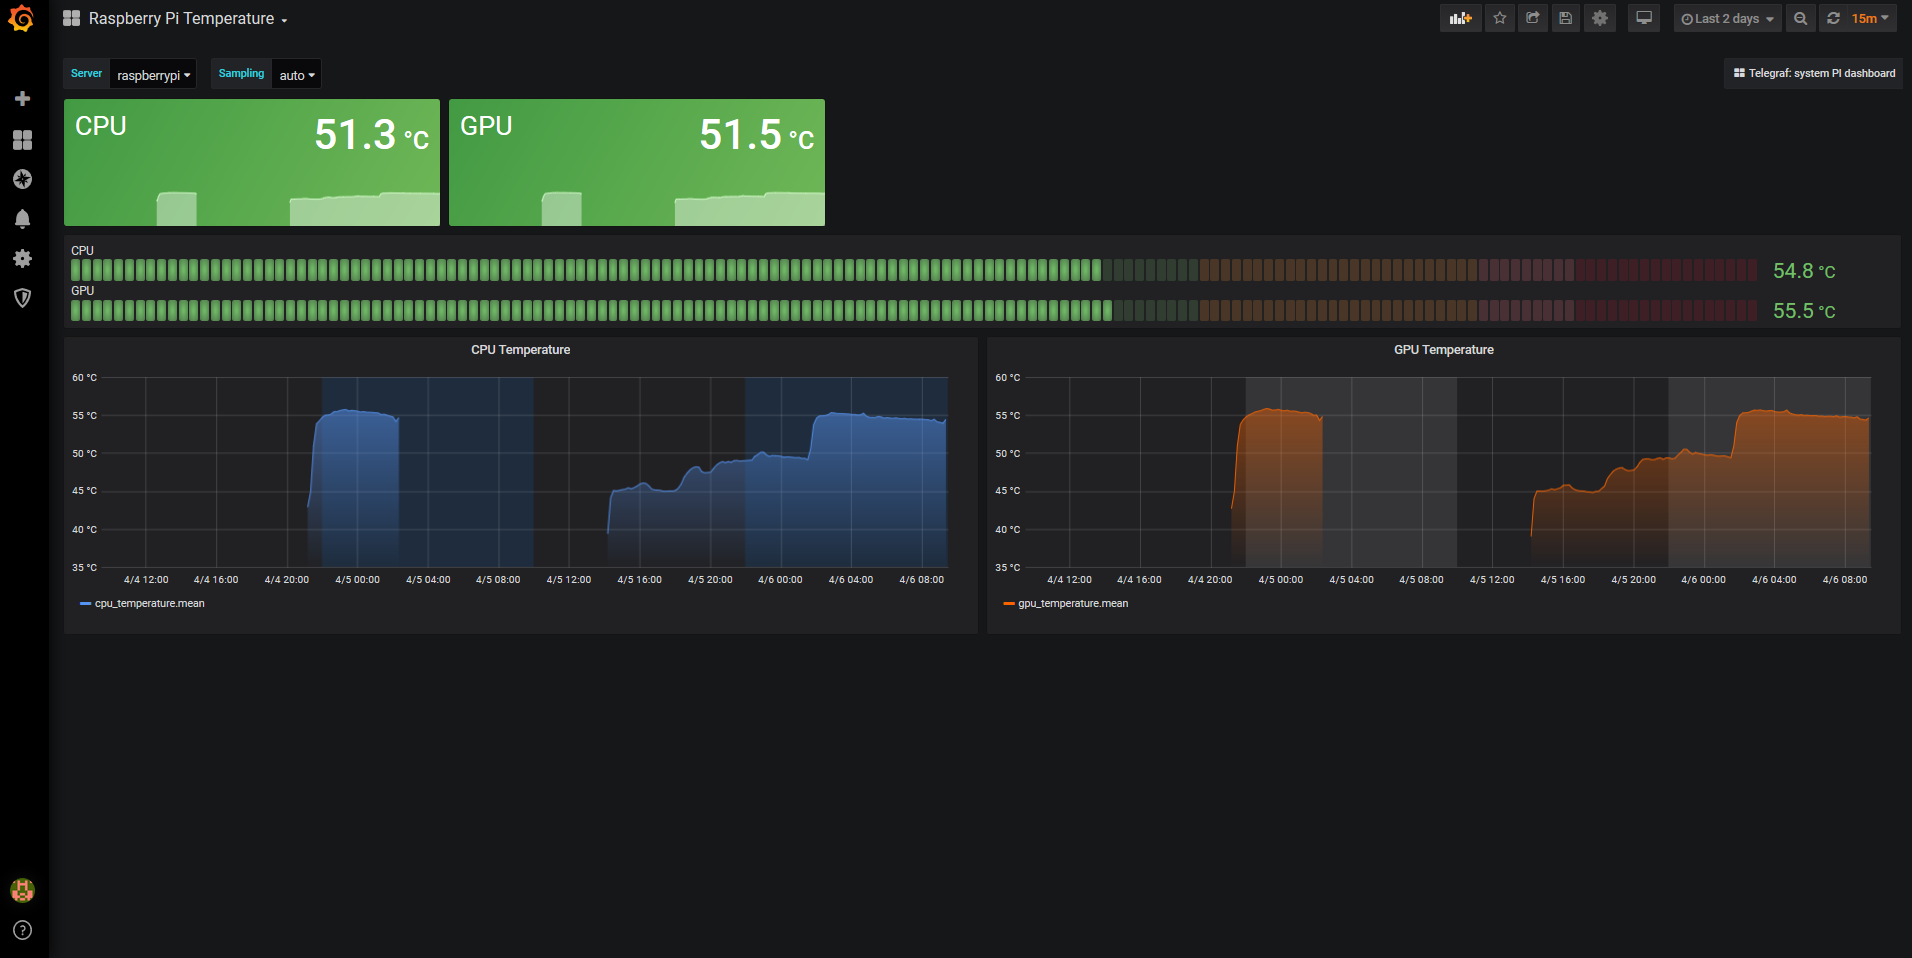
Grafana dasborad designed for Raspberry pi Systems (temperatures for CPU and GPU). Yes, too much exec inputs but I could't make grok to label each field diferent for each script.
Data source config
Collector type:
Collector plugins:
Collector config:
Revisions
Upload an updated version of an exported dashboard.json file from Grafana
| Revision | Description | Created | |
|---|---|---|---|
| Download |
Raspberry Pi
Easily monitor Raspberry Pi, the small, single-board computers, with Grafana Cloud's out-of-the-box monitoring solution.
Learn more