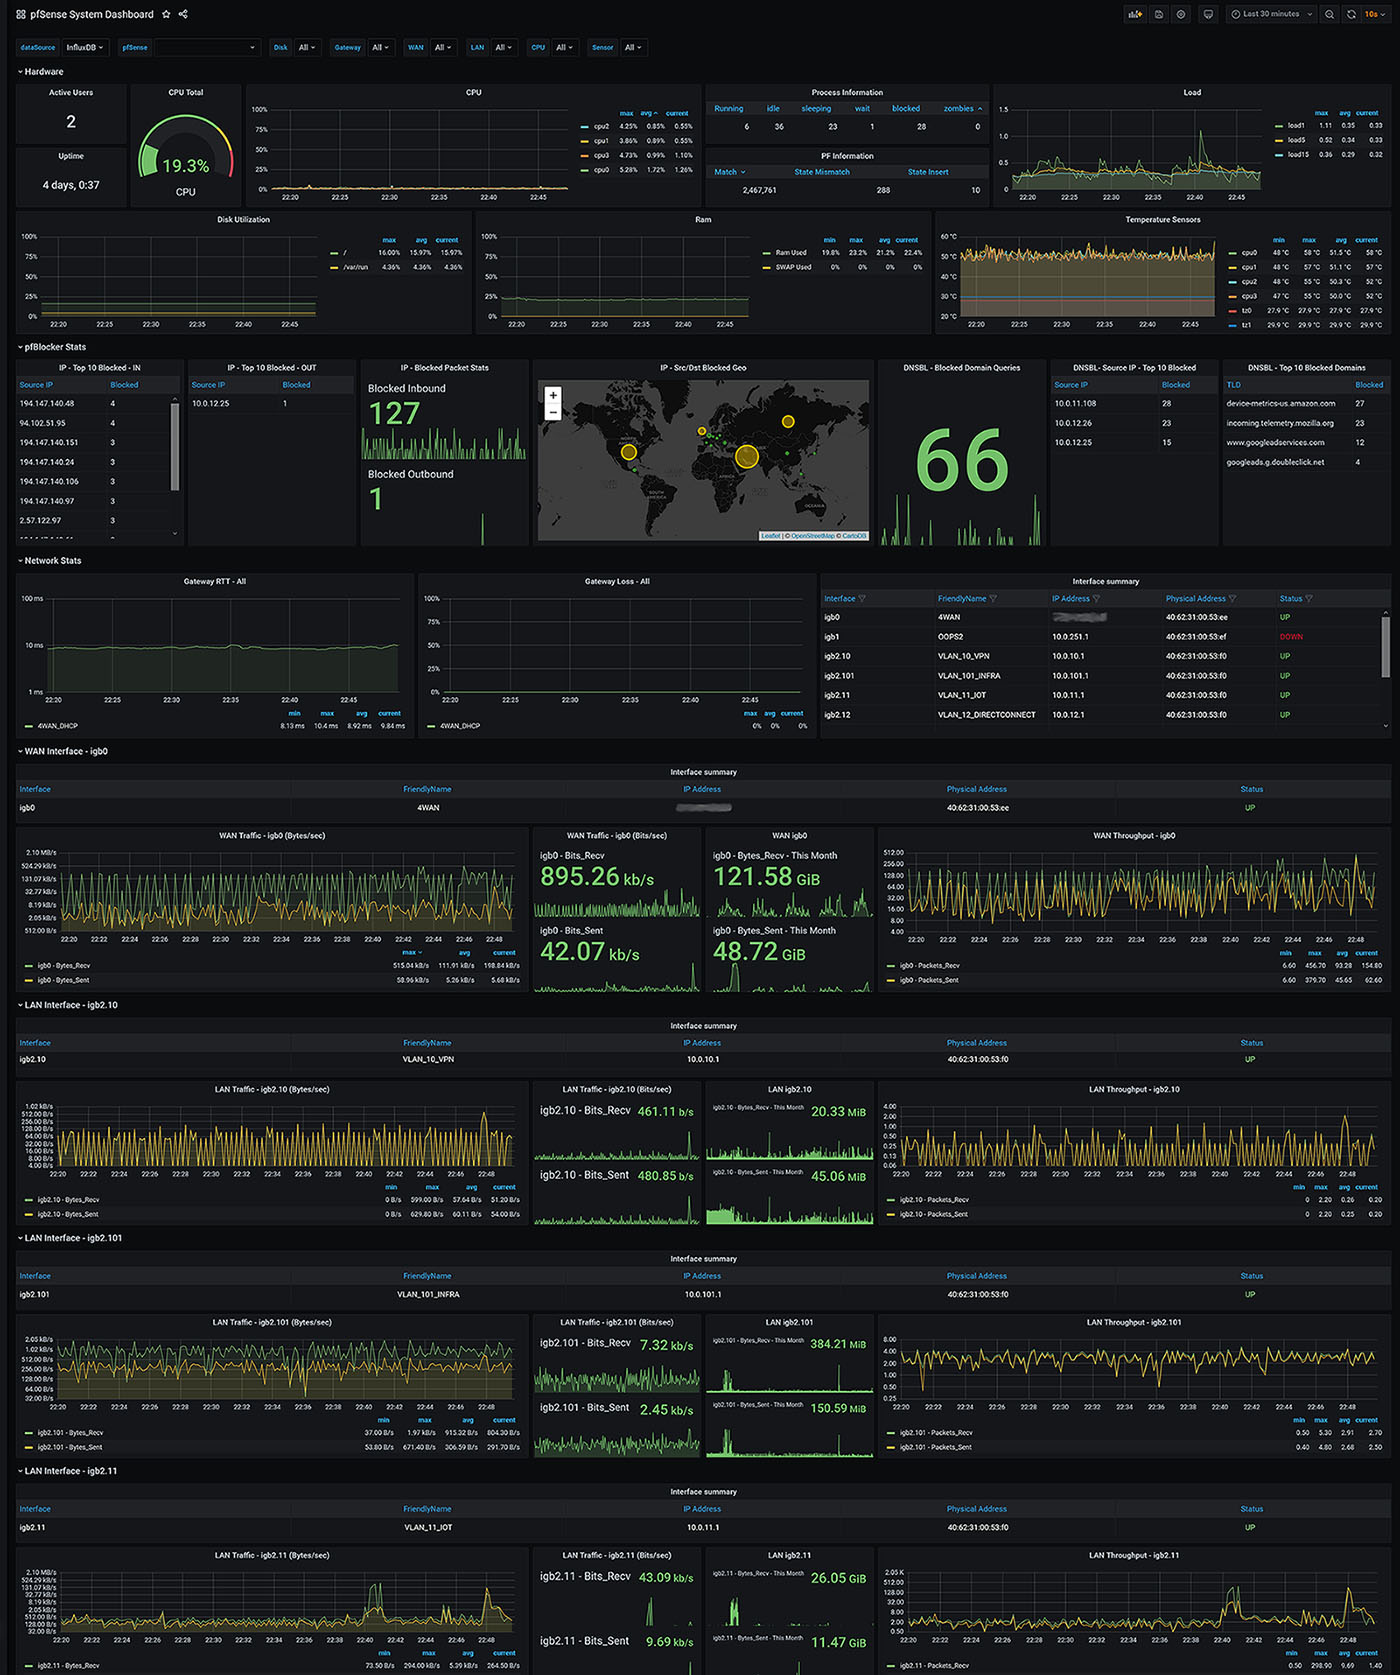
pfSense System Dashboard
See the github link for the most up-to-date dashboard. A Grafana dashboard built to monitor pfSense that relies on influx and Telegraf. All artifacts and instructions are maintained in github at https://github.com/VictorRobellini/pfSense-Dashboard
For the latest version, visit: https://github.com/VictorRobellini/pfSense-Dashboard
What's Monitored
- Active Users
- Uptime
- CPU Load total
- Disk Utilization
- Memory Utilization
- CPU Utilization per core (Single Graph)
- Ram Utilization time graph
- Load Average
- Load Average Graph
- CPU and ACPI Temperature Sensors
- pfBlocker IP Stats
- pfBlocker DNS Stats
- Gateway Response time - dpinger
- List of interfaces with IP, MAC, Status and pfSesnse labels thanks to /u/trumee
- WAN Statistics - Traffic & Throughput (Identified by dashboard variable)
- LAN Statistics - Traffic & Throughput (Identified by dashboard variable)
- Unbound stats - Plugin and config included and working but not implemented
Configuration
Grafana
The Config for the dashboard relies on the variables defined within the dashboard in Grafana. When importing the dashboard, make sure to select your datasource.
Dashboard Settings -> Variables
WAN - $WAN is a static variable defined so that a separate dashboard panel can be created for WAN interfaces stats. Use a comma-separated list for multiple WAN interfaces.
LAN_Interfaces - $LAN_Interfaces uses a regex to remove any interfaces you don't want to be grouped as LAN. The filtering happens in the "Regex" field. I use a negative lookahead regex to match the interfaces I want excluded. It should be pretty easy to understand what you need to do here. I have excluded igb0 (WAN) and igb2 (only used to host vlans).
After writing this up, I realize I need to change this variable name, it's just not going to happen right now.
Telegraf
Telegraf Config
In the /config directory you will find all of the additional telegraf config. In pfSense, under Services -> Teltegraf, at the bottom of the page with the teeny tiny text box is where you paste in the included config.
I also included the config for Unbound DNS and it's commented out. I'm not currently using it, but it's fully functional, just uncomment if you want to use it.
Plugins
Plugins
I put all my plugins in /usr/local/bin and set them to 555
To troubleshoot plugins, add the following lines to the agent block in /usr/local/etc/telegraf.conf and send a HUP to the telegraf pid.
debug = true
quiet = false
logfile = "/var/log/telegraf/telegraf.log"
I also included a wrapper script for Unbound DNS. I'm not currently using it, but it's fully functional.
Running on
Grafana 6.7.1
Influxdb 1.7.10
Data source config
Collector config:
Upload an updated version of an exported dashboard.json file from Grafana
| Revision | Description | Created | |
|---|---|---|---|
| Download |

