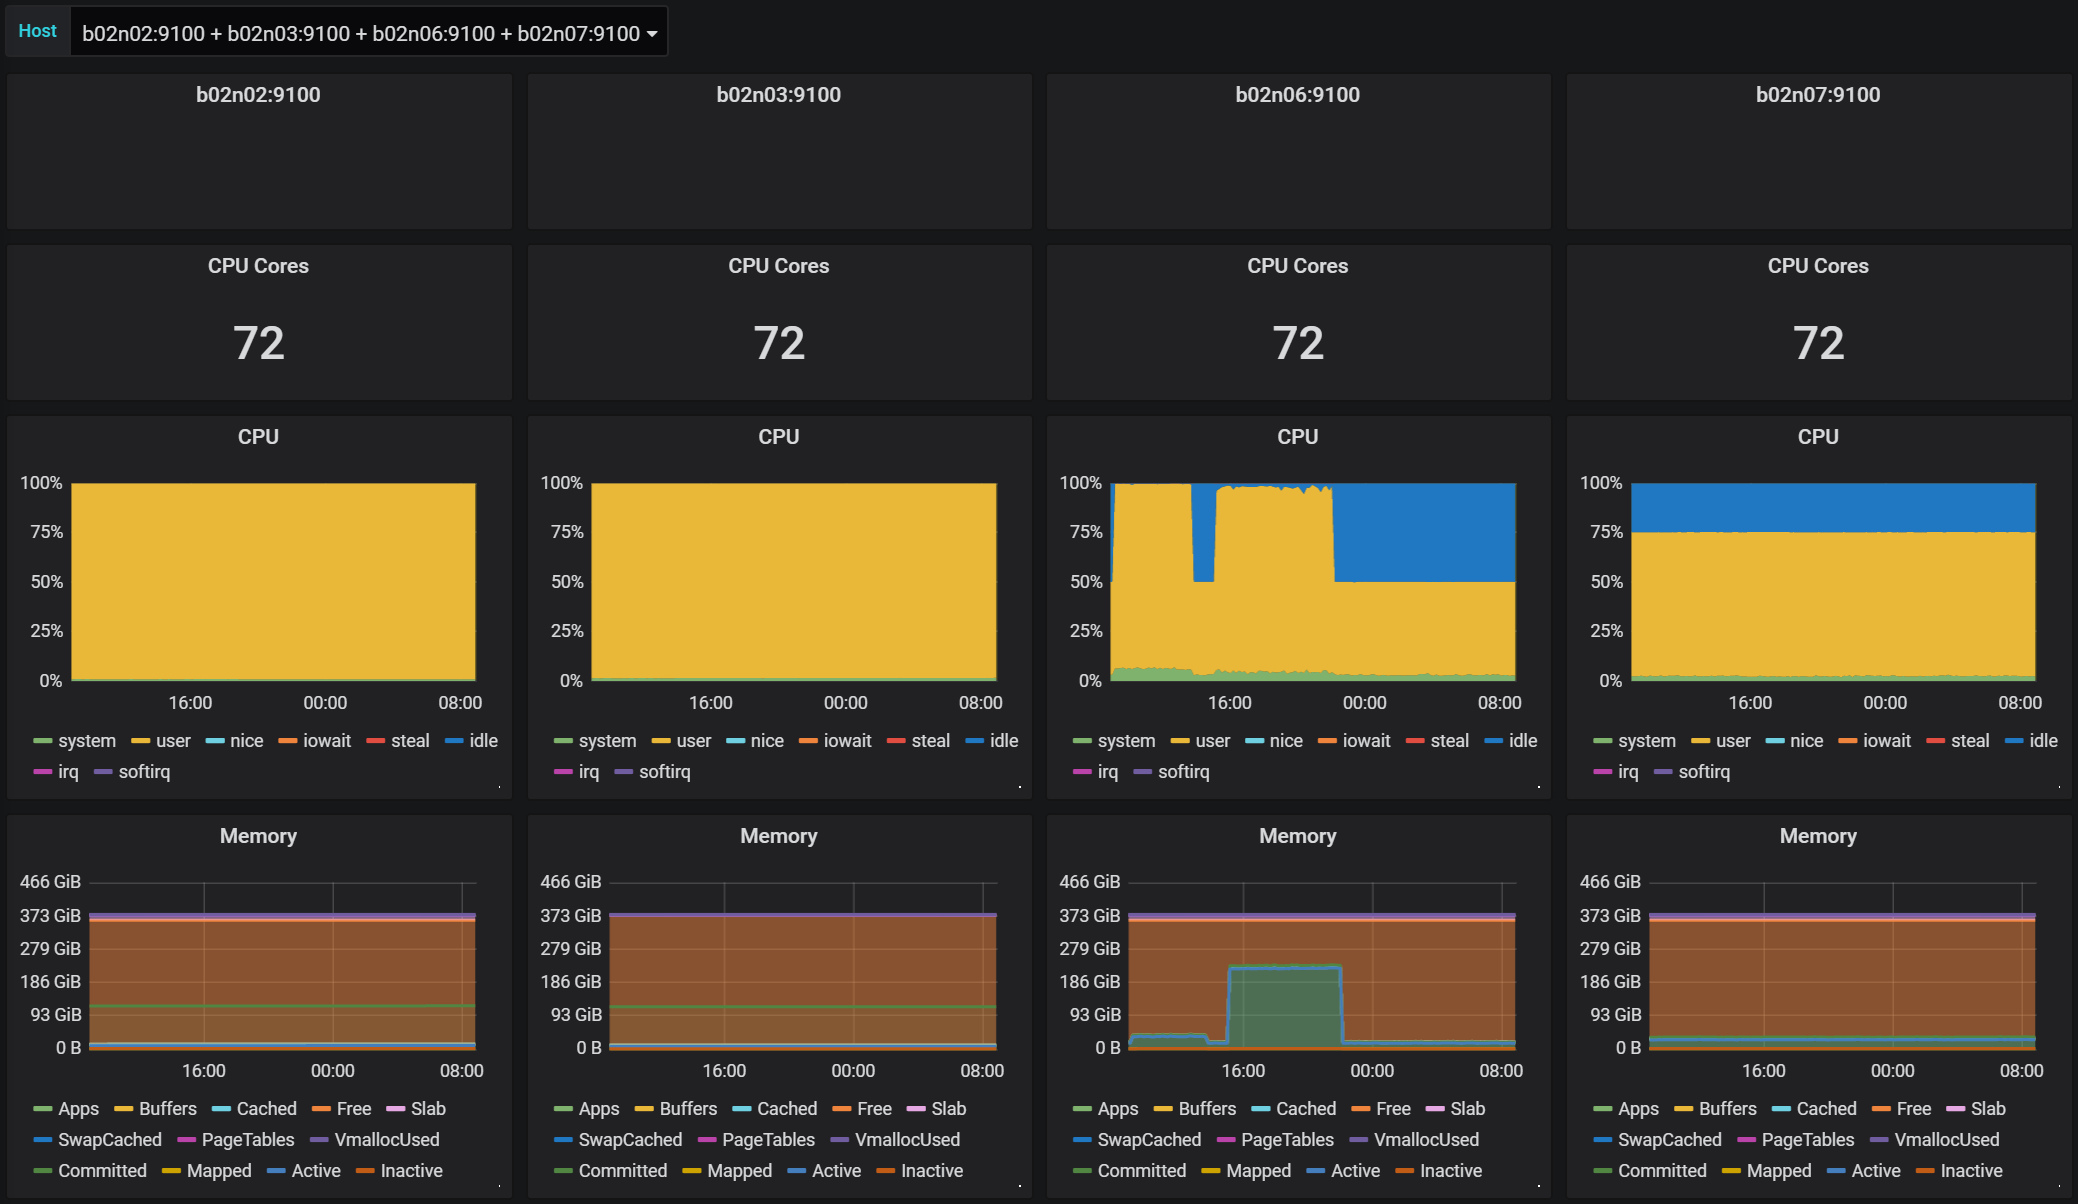
Node Exporter Server Metrics v2
Dashboard to view multiple servers
Based on https://grafana.com/grafana/dashboards/405
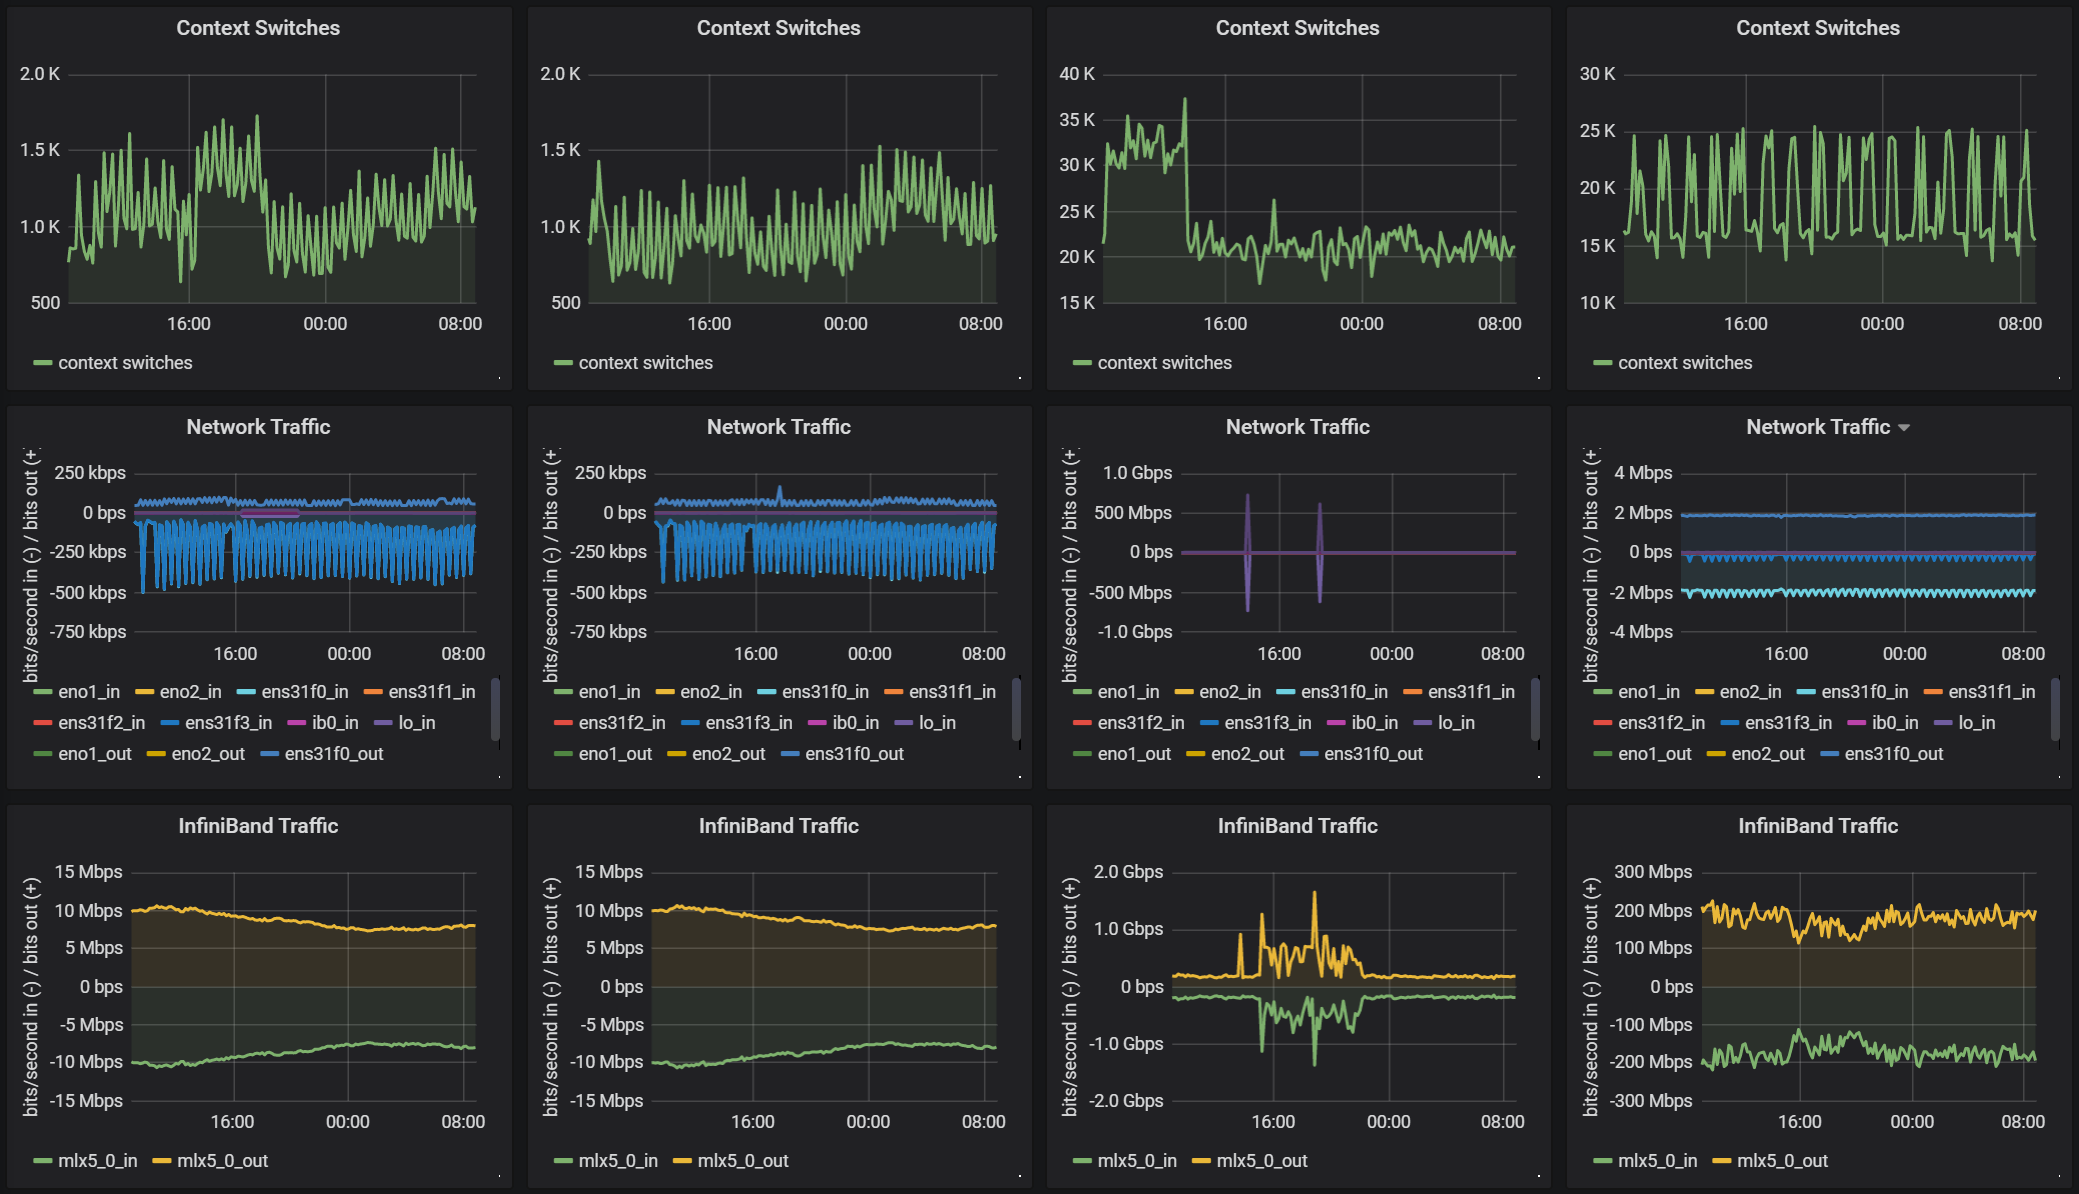
- Added InfiniBand Traffic
- Fix Omni-Path traffic bandwidth
Tip: Network Traffic does not include RDMA traffic, InfiniBand Traffic includes RDMA and non-RDMA traffic of InfiniBand and Omni-Path.
Data source config
Collector config:
Upload an updated version of an exported dashboard.json file from Grafana
| Revision | Description | Created | |
|---|---|---|---|
| Download |
Linux Server
Monitor Linux with Grafana. Easily monitor your Linux deployment with Grafana Cloud's out-of-the-box monitoring solution.
Learn more

