
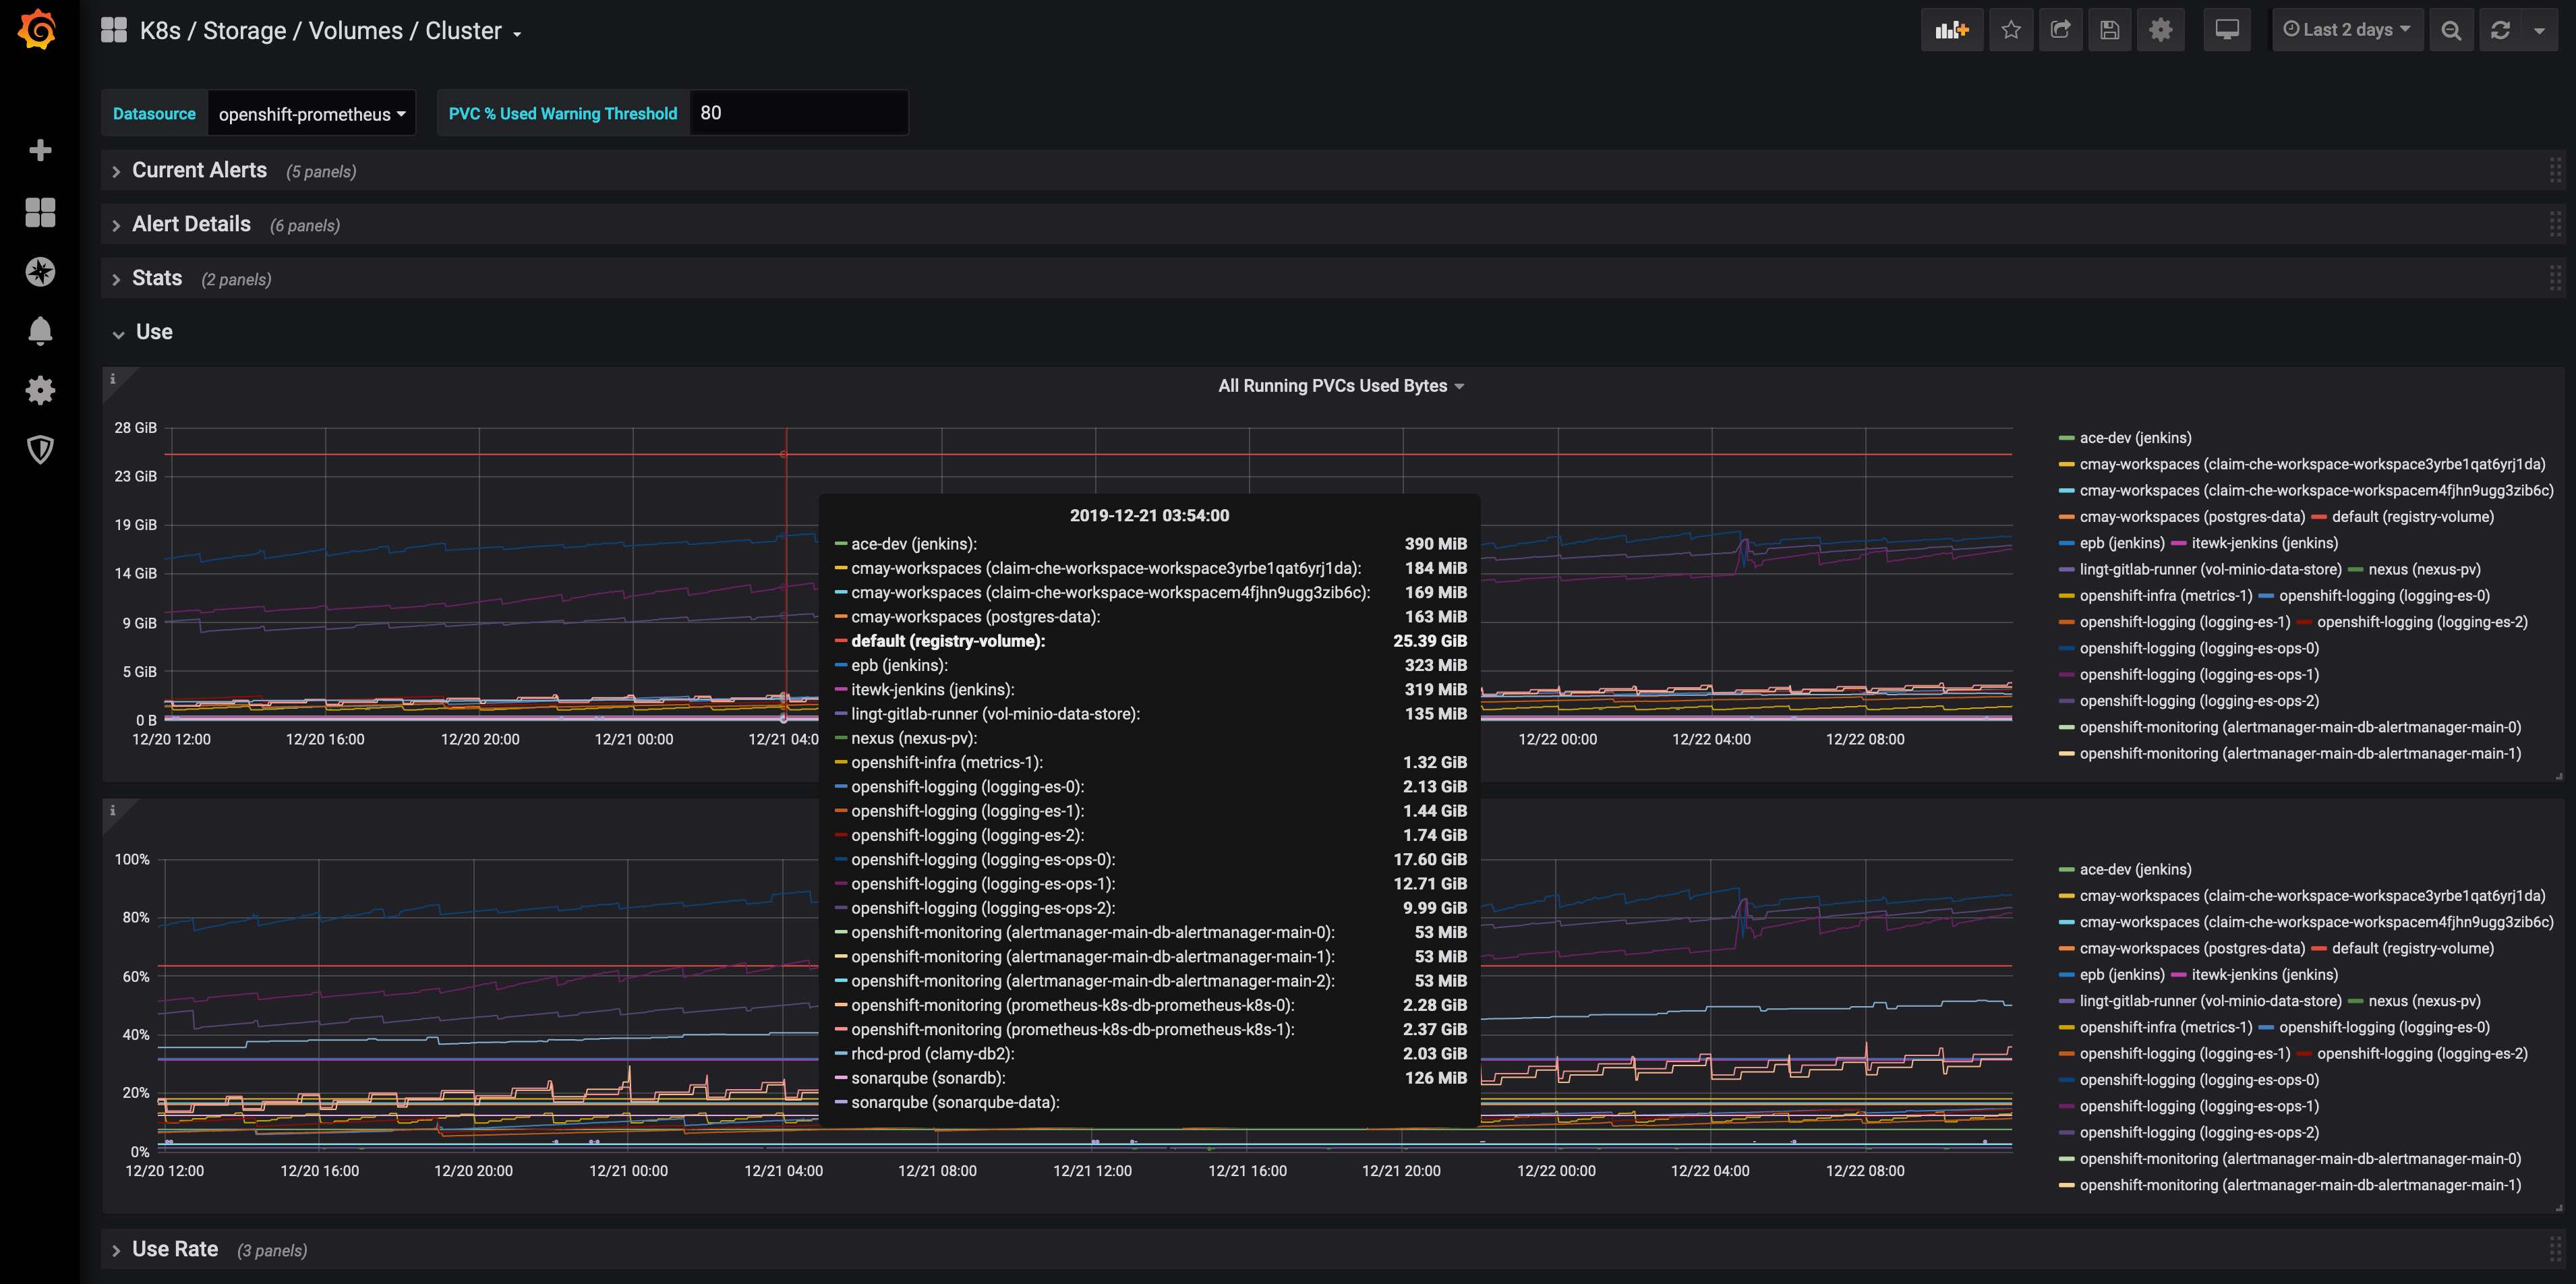
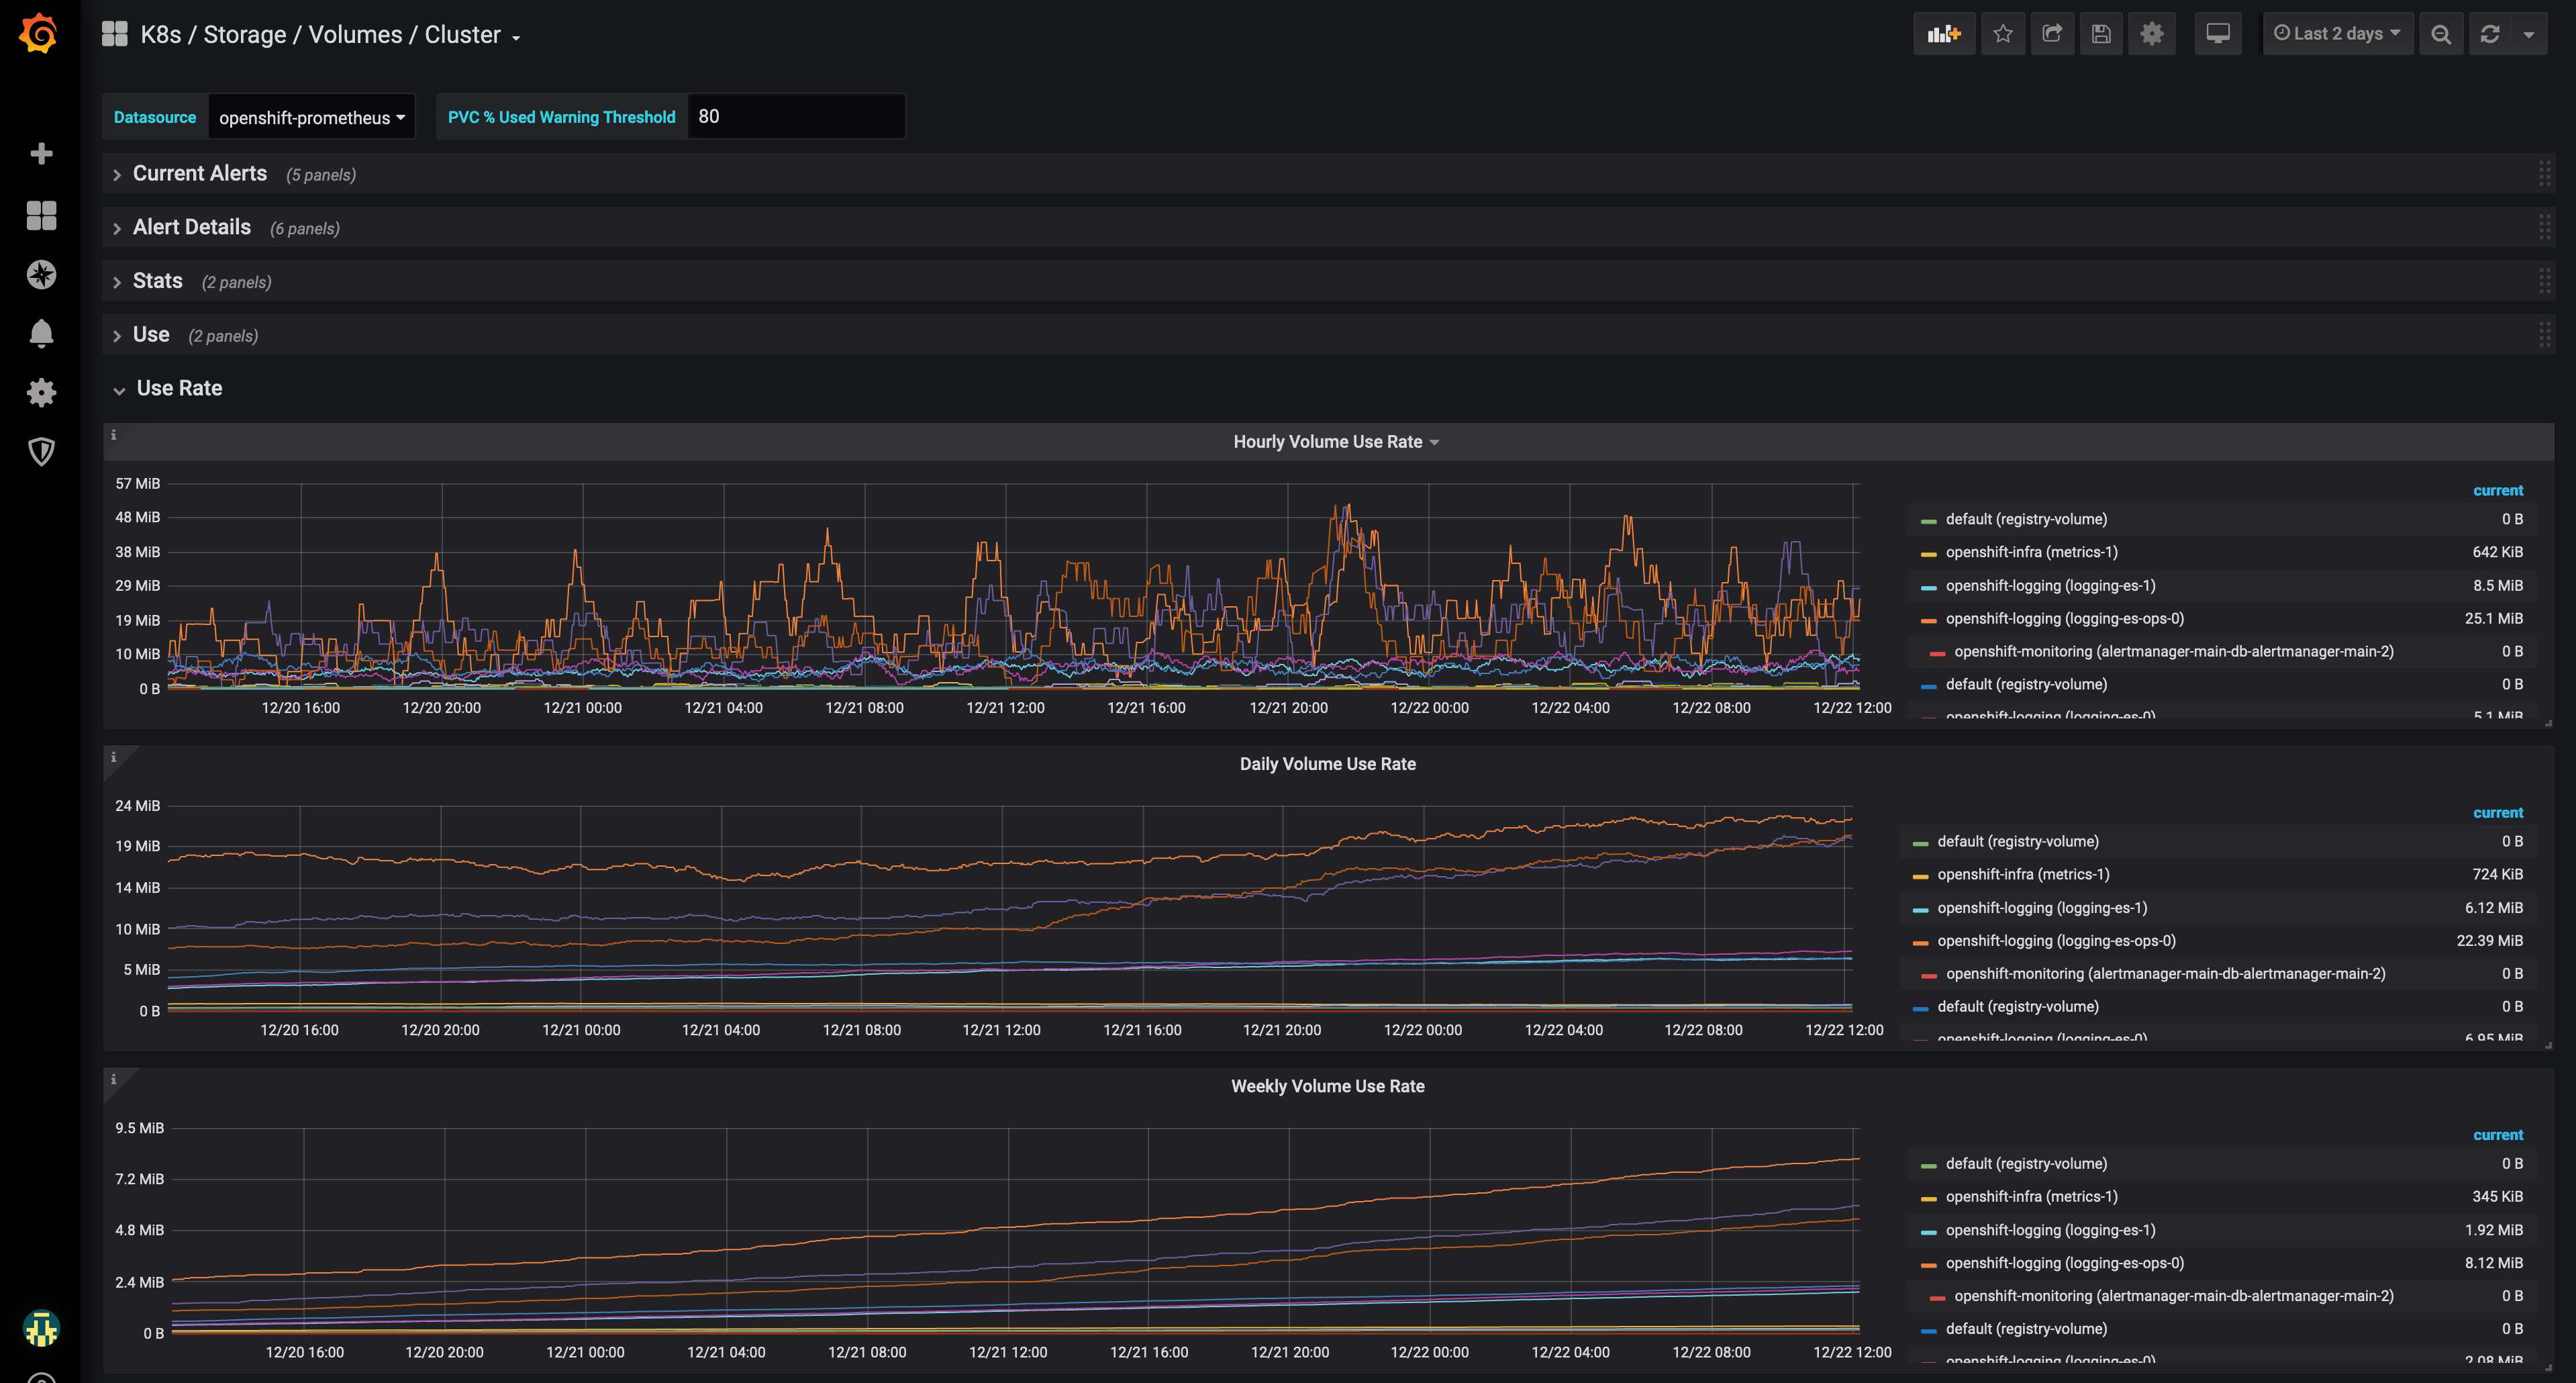
K8s / Storage / Volumes / Cluster
Dashboard of Kubernetes / OpenShift volume information at cluster level as exported by Prometheus connected to Kubernetes / OpenShift.
Overview
Dashboard of Kubernetes / OpenShift volume information at cluster level as exported by Prometheus connected to Kubernetes / OpenShift.
Expects
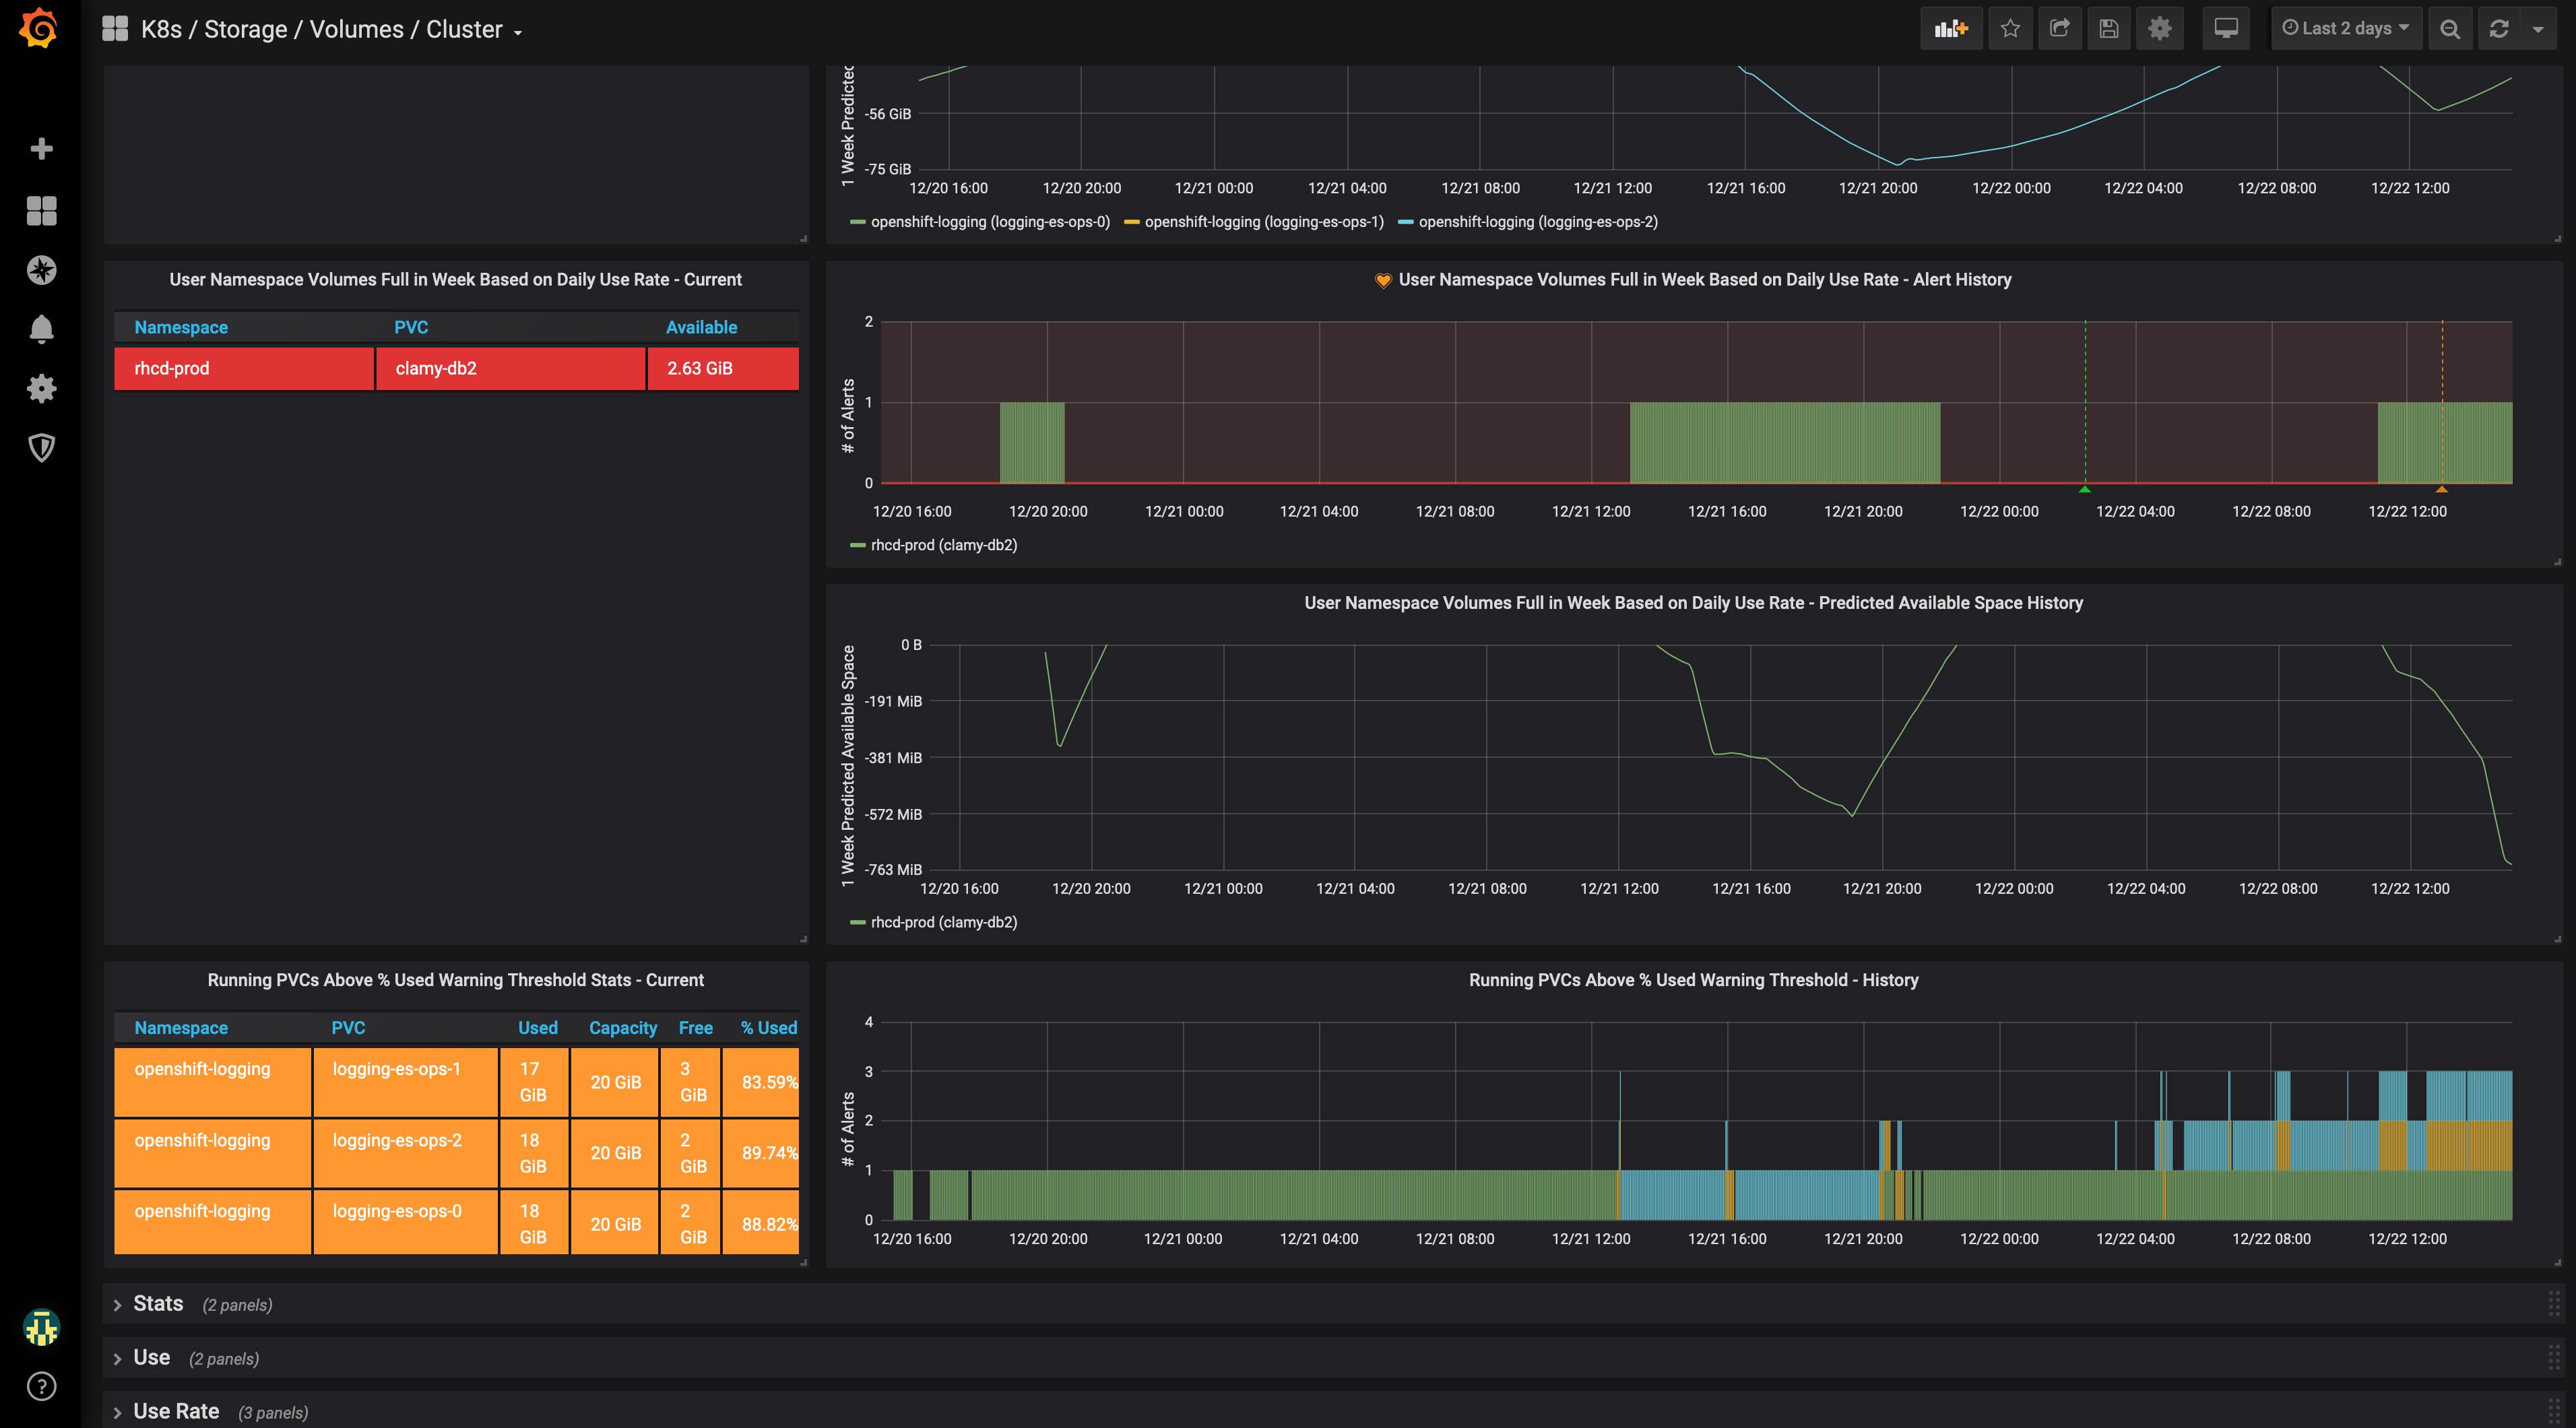
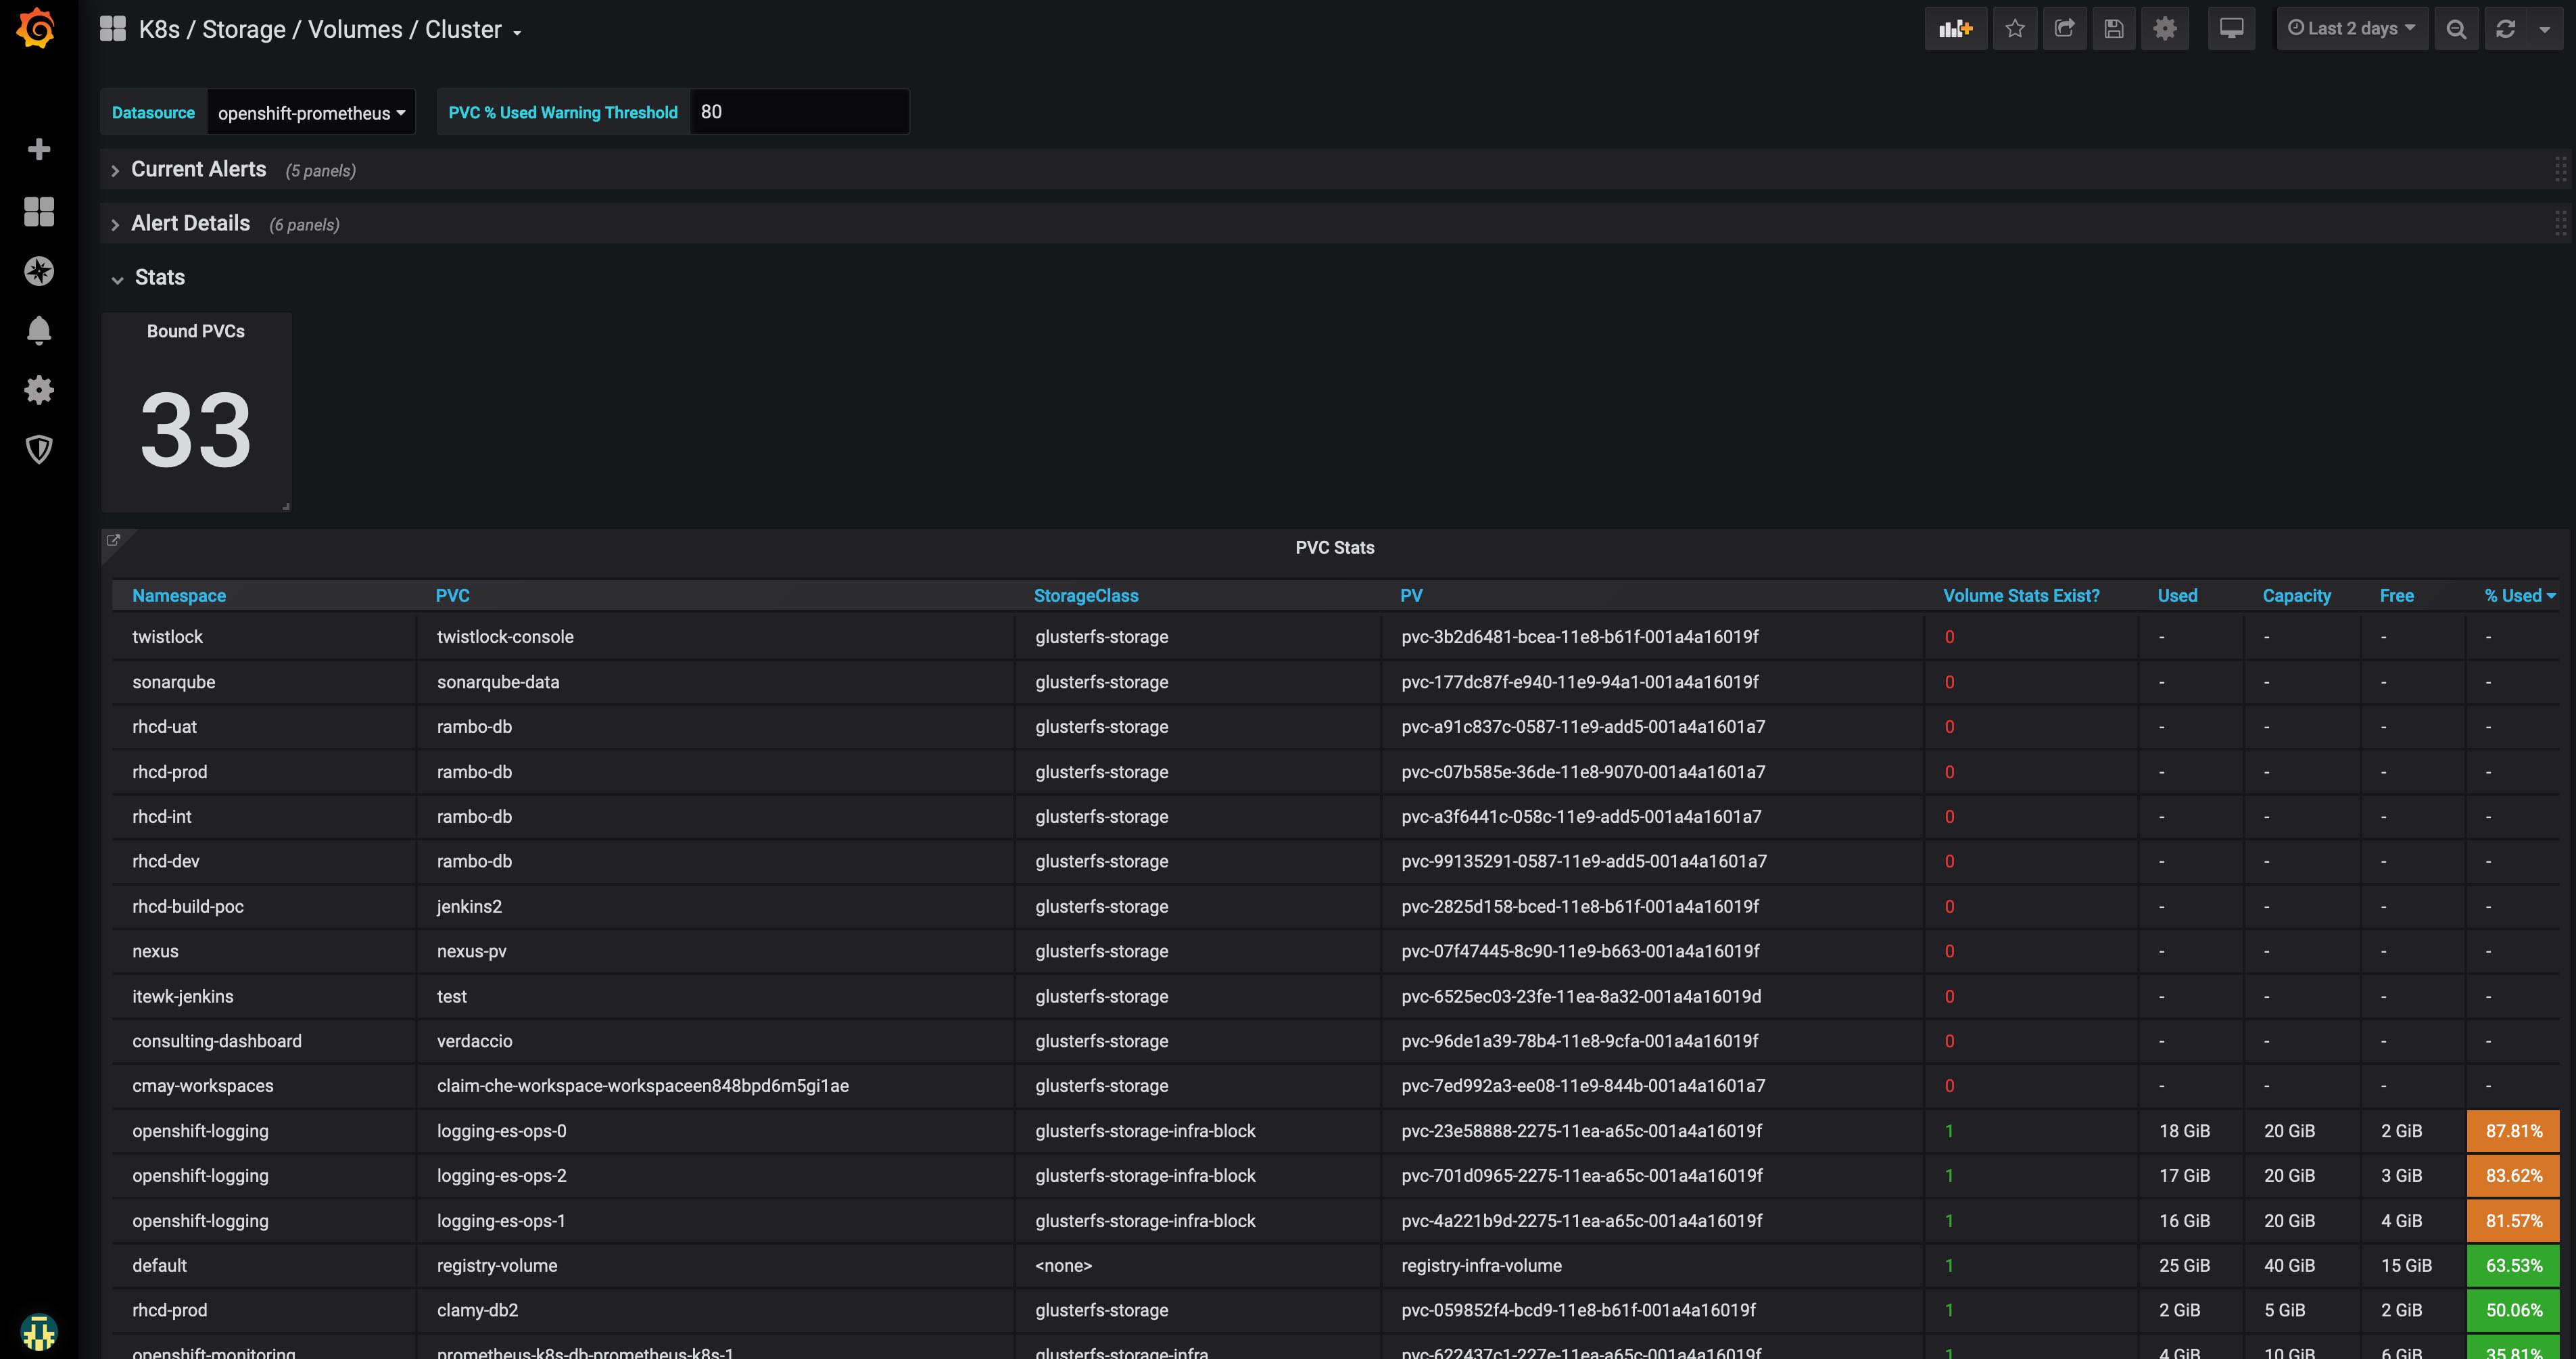
pv_collector_bound_pvc_countpv_collector_unbound_pvc_countkube_persistentvolumeclaim_infokubelet_volume_stats_used_byteskubelet_volume_stats_available_byteskubelet_volume_stats_capacity_bytes
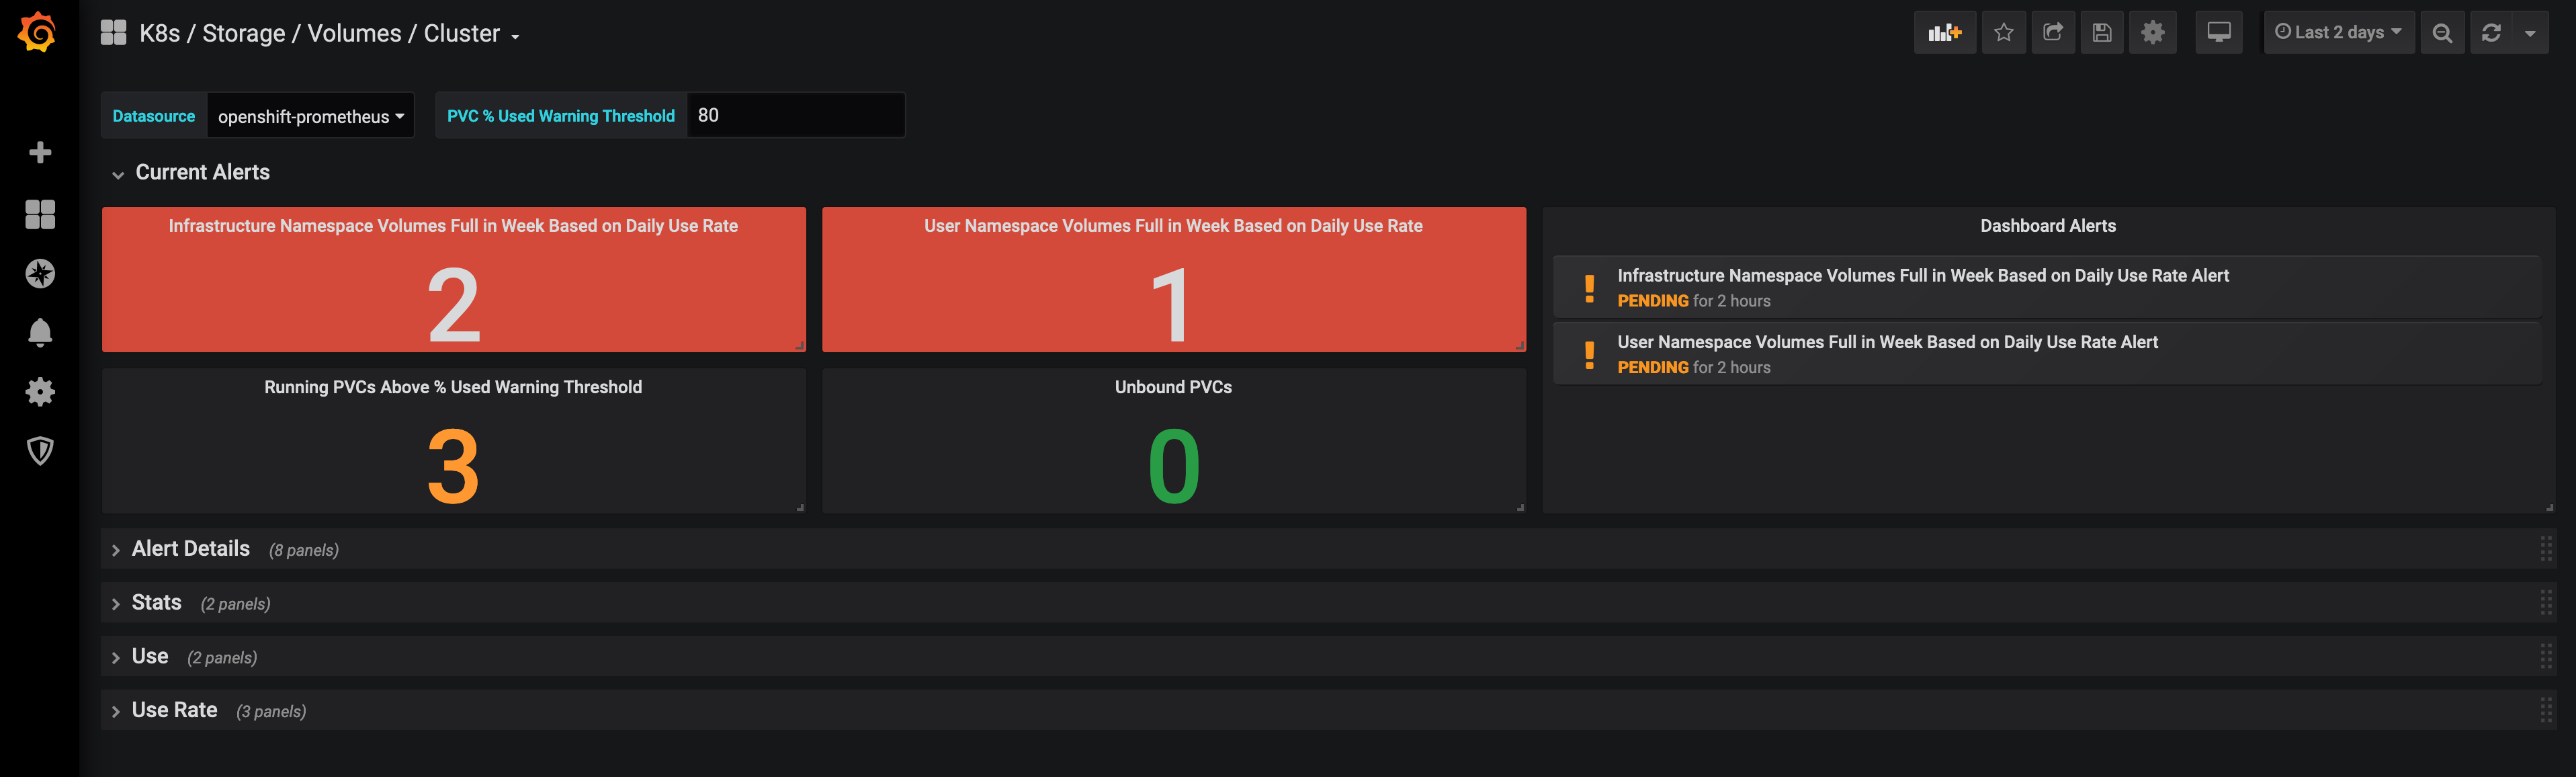
Published Grafana Alerts
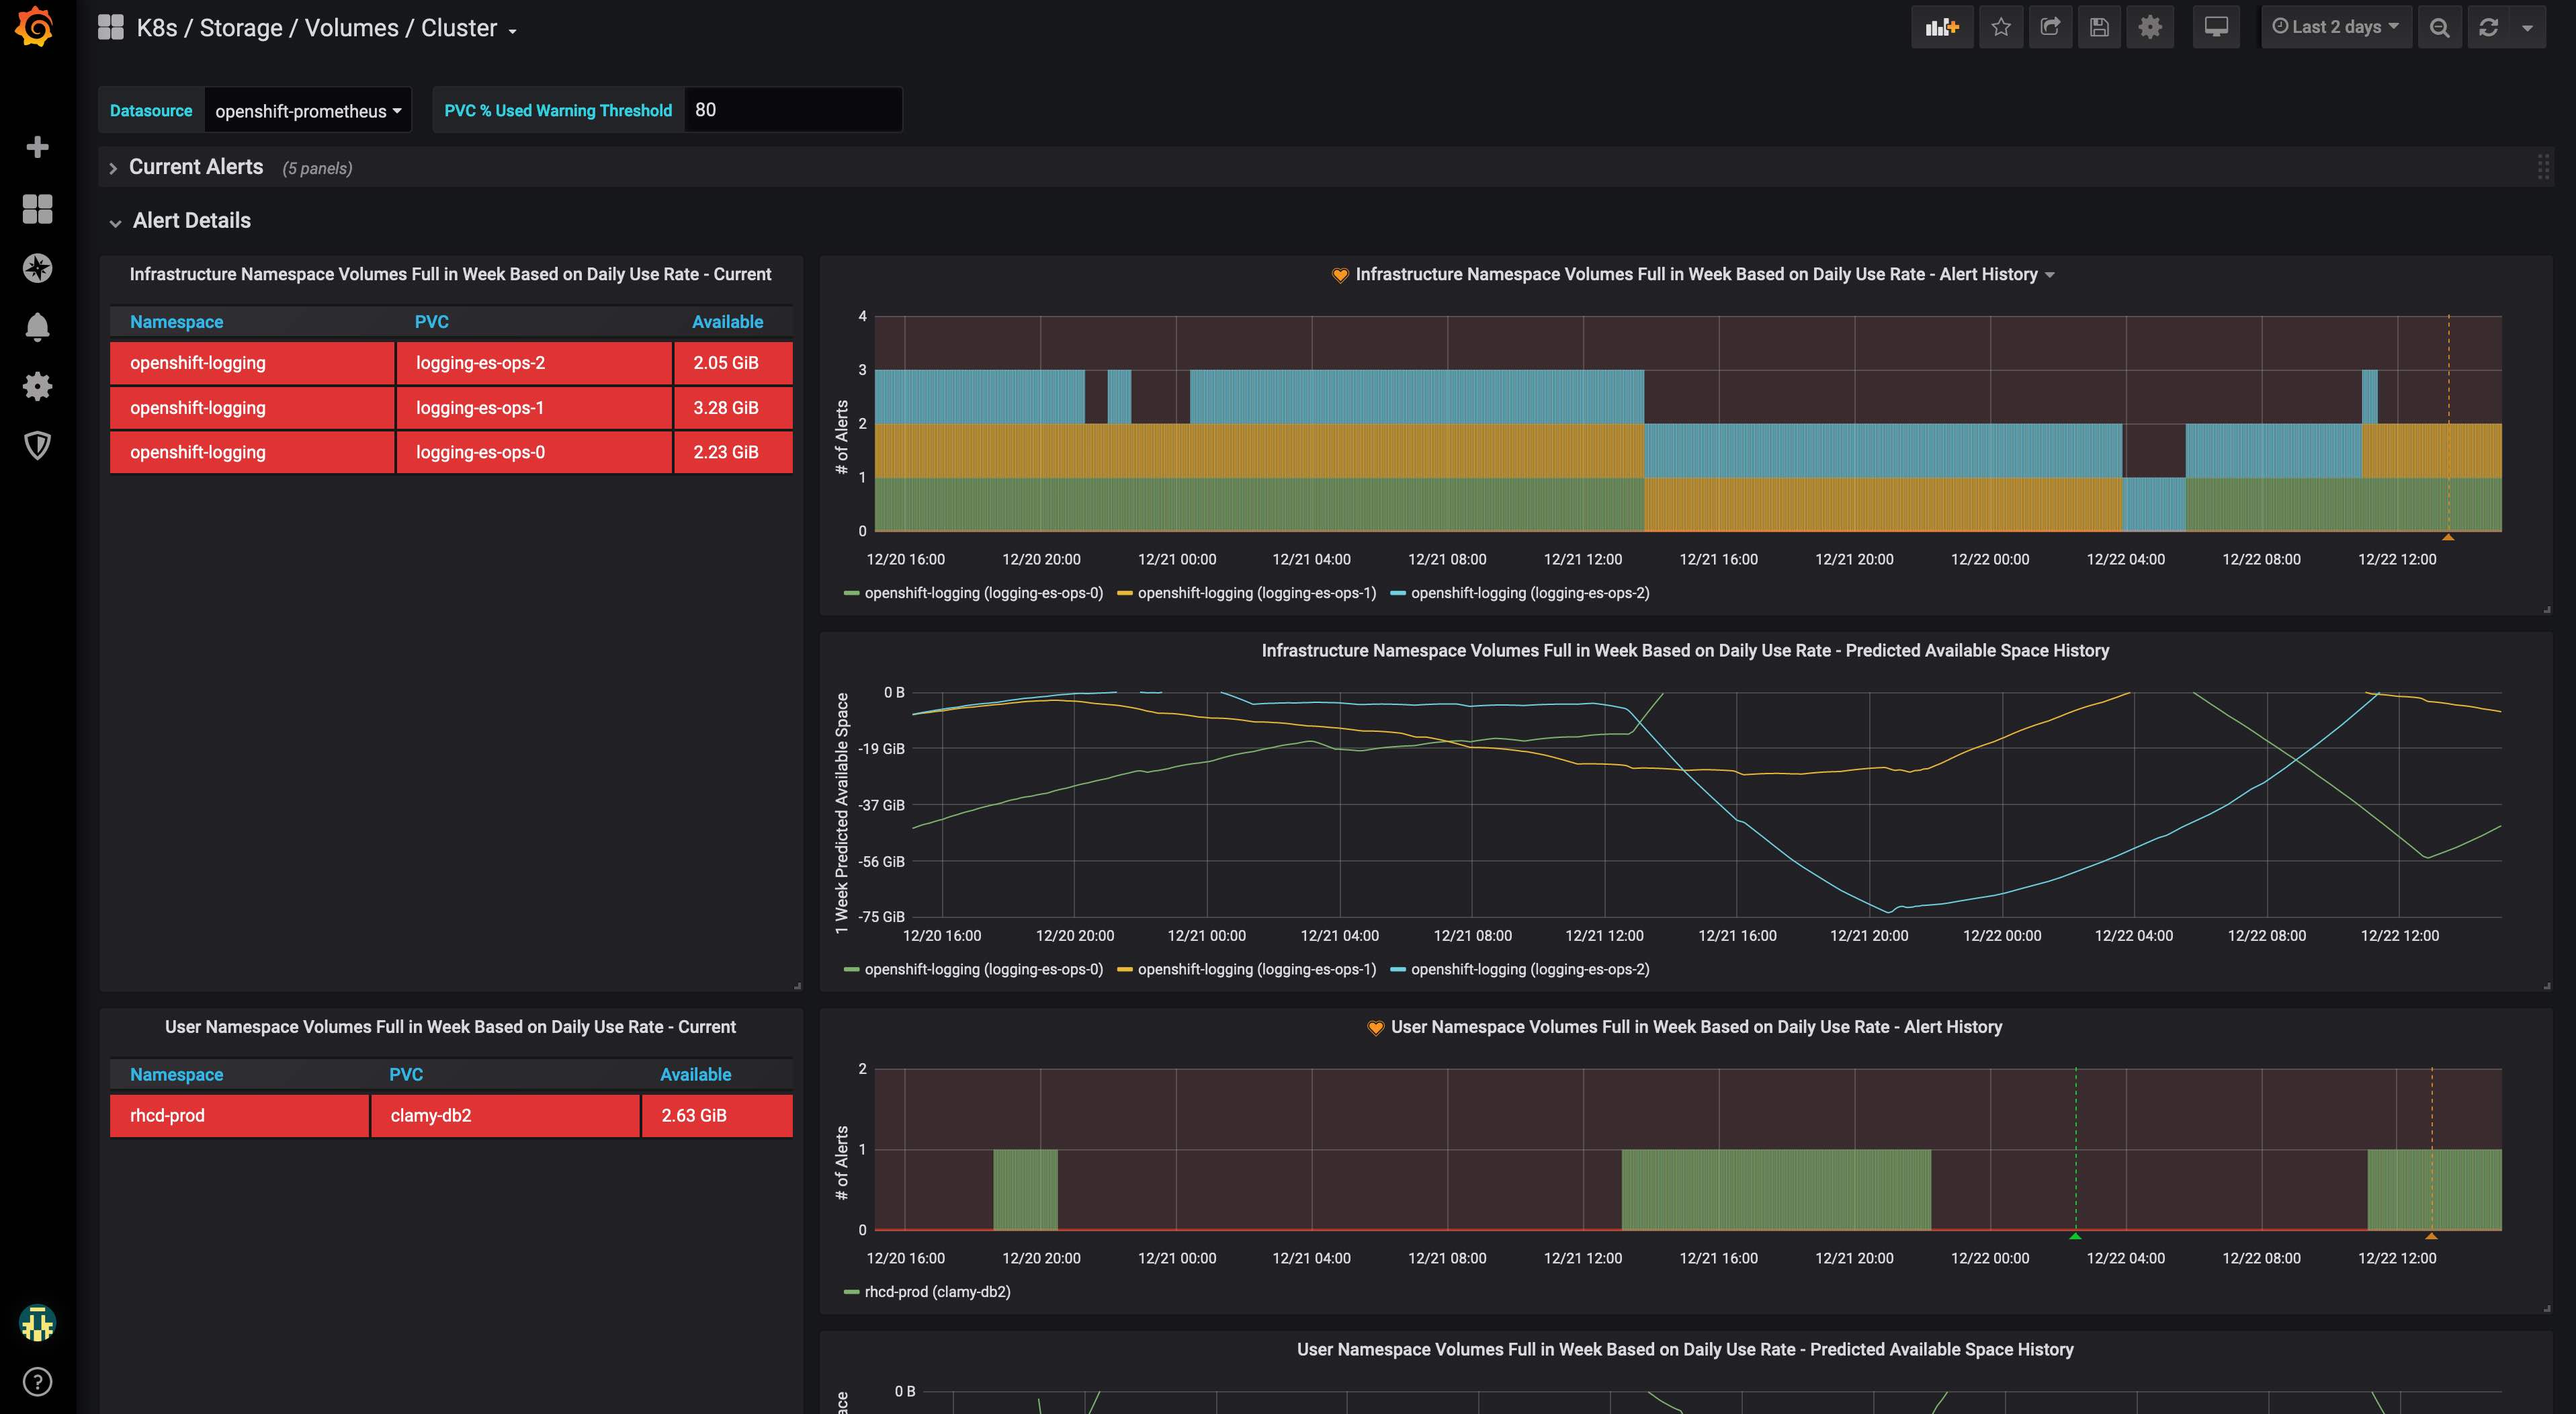
Infrastructure Namespace Volumes Full in Week Based on Daily Use Rate AlertUser Namespace Volumes Full in Week Based on Daily Use Rate Alert
Documentation
- Set up Prometheus on OpenShift - Red Hat OpenShiftr Container Platform 3.11: Configuring Clusters: Prometheus Cluster Monitoring
Tested With
- OpenShift Container Platform (OCP)
- v3.11.154
- OpenShift Container Storage (OCS)
- 3.11
- Grafana
- v6.5.2
- Prometheus
- v2.3.2
Related Boards
Data source config
Collector type:
Collector plugins:
Collector config:
Revisions
Upload an updated version of an exported dashboard.json file from Grafana
| Revision | Description | Created | |
|---|---|---|---|
| Download |
Kubernetes
Monitor your Kubernetes deployment with prebuilt visualizations that allow you to drill down from a high-level cluster overview to pod-specific details in minutes.
Learn more