
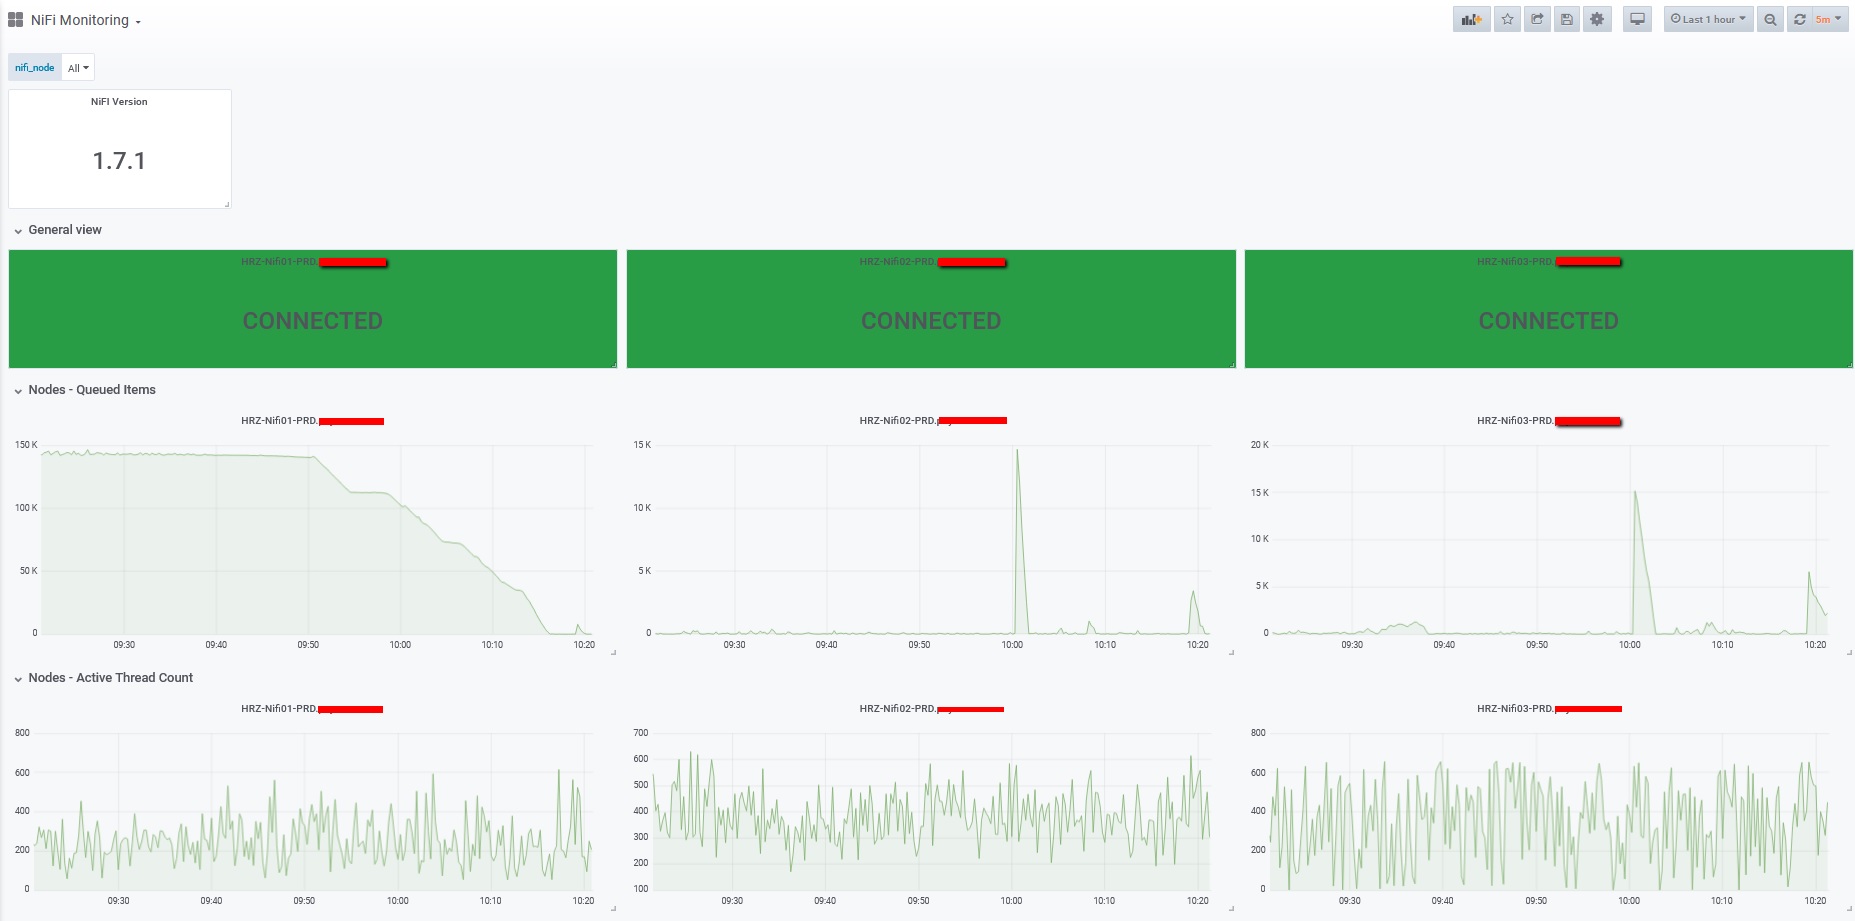
NiFi Monitoring
General view of Nifi
NiFi Exporter
Prometheus exporter for Nifi metrics written in python
Data is scraped by prometheus.
Based on the nifi exporter
https://github.com/mormor83/NiFi_Exporter
Metrics
All metrics are prefixed with "nifi_".
Nodes
| metric | description |
|---|---|
| nifi_nodes_status | General status per node |
| nifi_node_activeThreadCount | Active Thread Count |
| nifi_node_queuedItems | Each node queued items |
Cluster
| metric | description |
|---|---|
| nifi_cluster_activeThreadCount | |
| nifi_cluster_terminatedThreadCount | |
| nifi_cluster_flowFilesQueued | |
| nifi_cluster_bytesQueued | |
| nifi_cluster_runningCount | |
| nifi_cluster_stoppedCount | |
| nifi_cluster_invalidCount |
Processor
| metric | description |
|---|---|
| nifi_amount_items_queued | Count the number of queued files per PG |
Data source config
Collector type:
Collector plugins:
Collector config:
Revisions
Upload an updated version of an exported dashboard.json file from Grafana
| Revision | Description | Created | |
|---|---|---|---|
| Download |