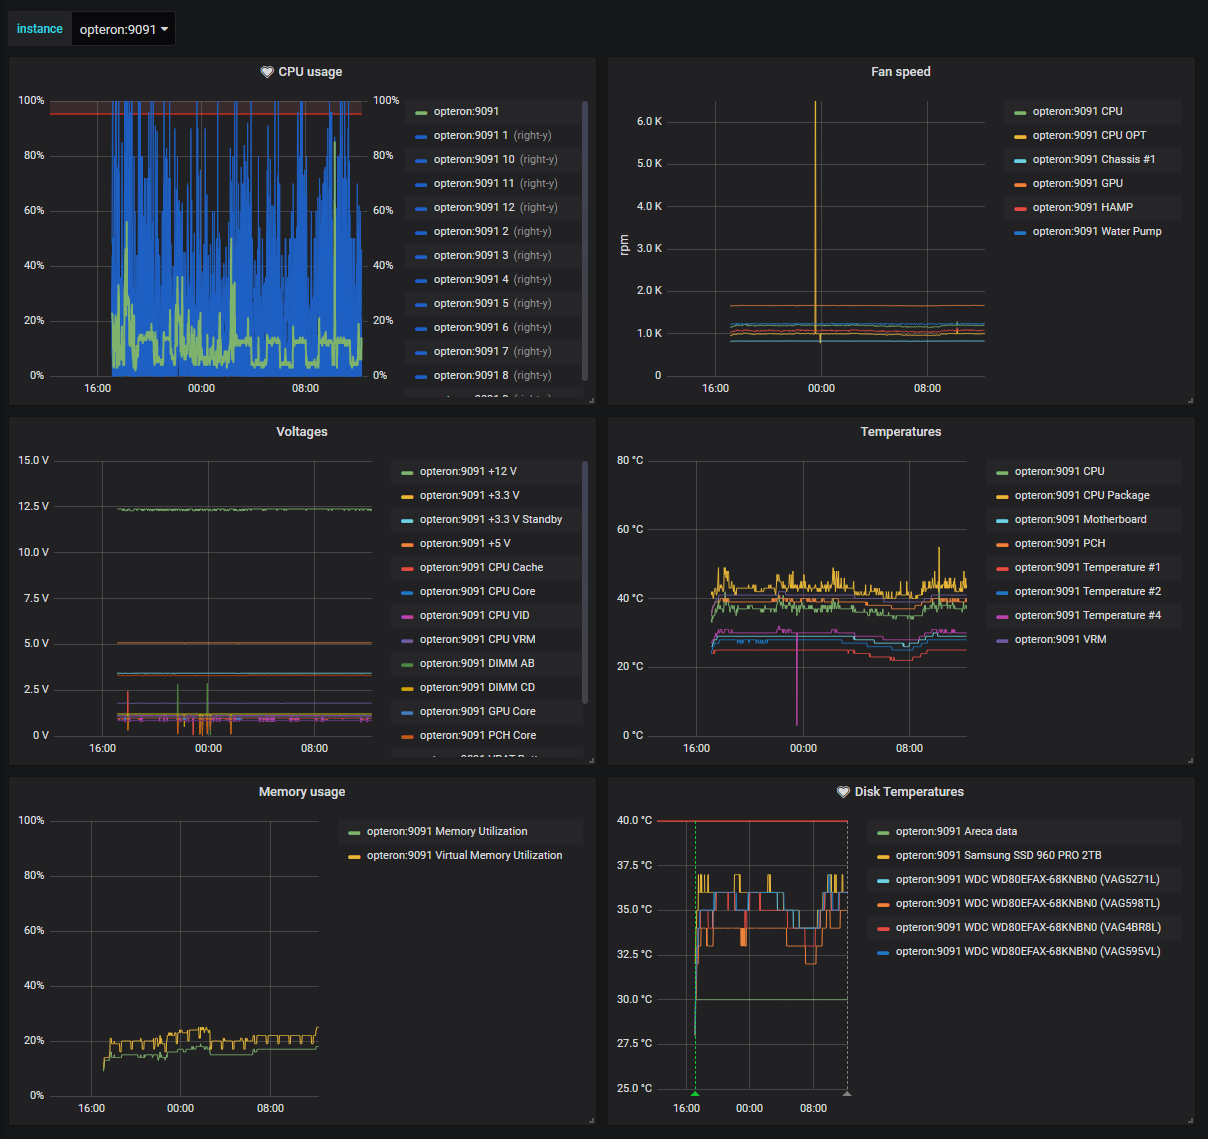
Windows AIDA64 Hardware Statistics
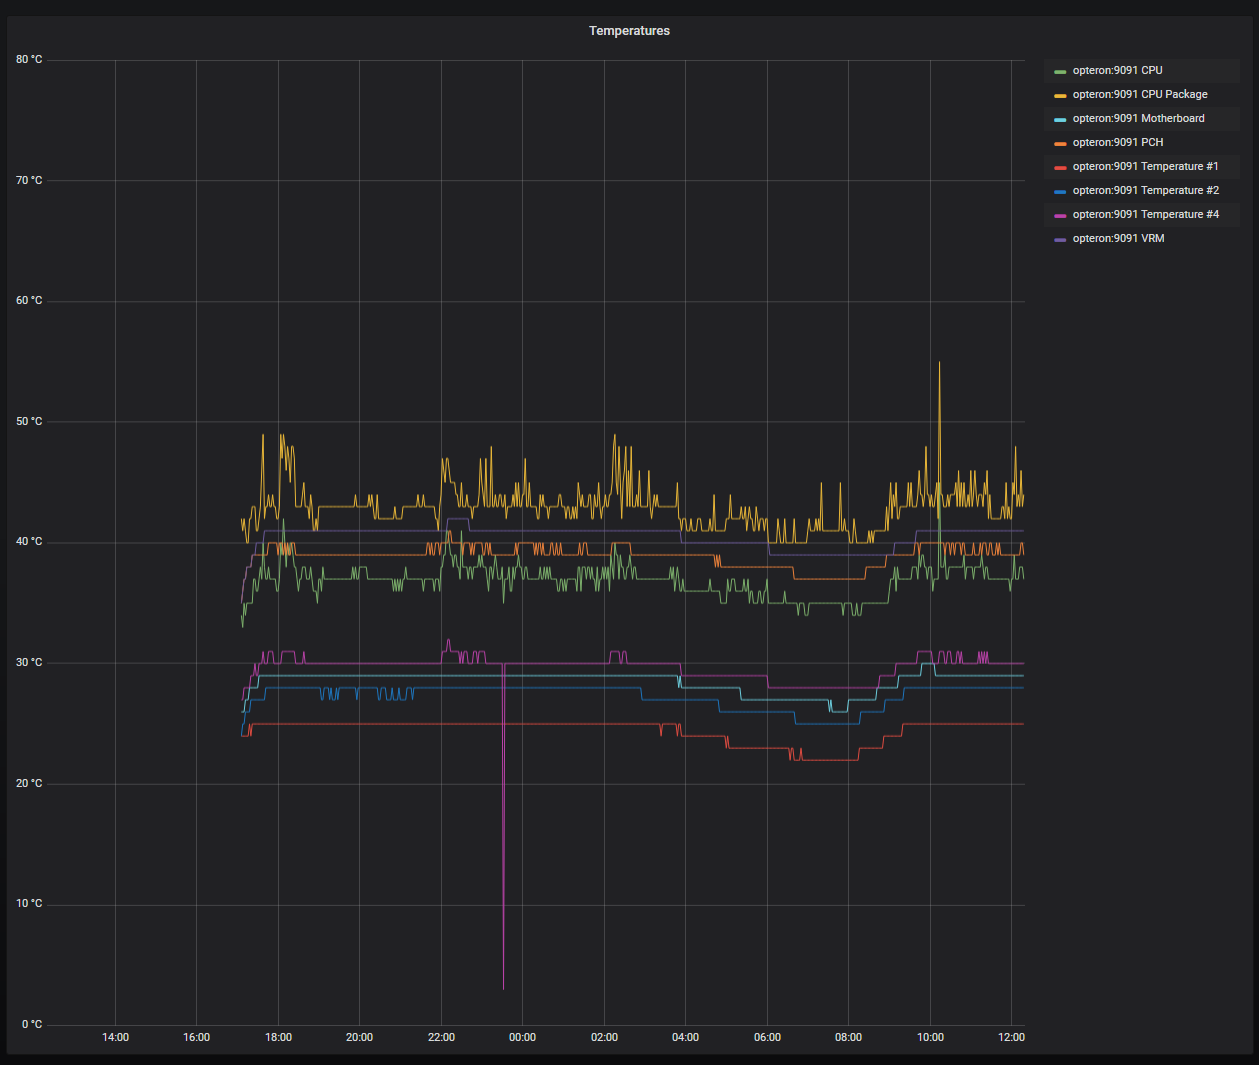
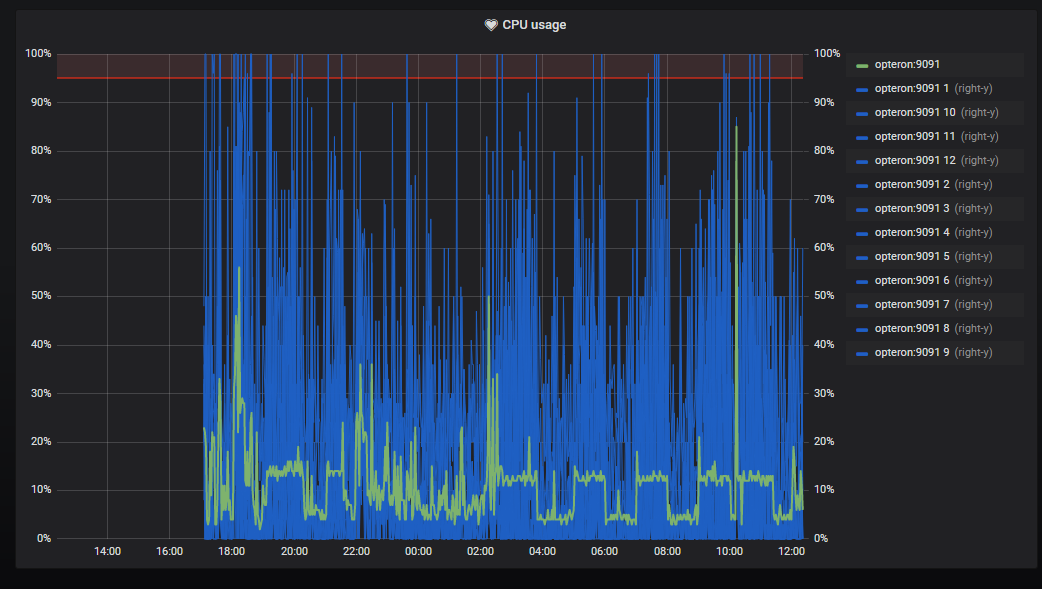
Dashboard that uses AIDA64 to export all of your Windows (hardware) statistics to show temperatures, voltages, clock speed, cpu usage, disk utilisation and usage, memory speed and utilisation.
To run this Dashboard you need 3 components:
- AIDA64
- Prometheus
- AIDA64_prometheus_exporter.py https://gist.github.com/WoLpH/558158dd92ce08cb2253c07934a12ad8
After starting AIDA64 you need to go to Preferences -> Hardware Monitoring -> External Applications and check the "Enable shared memory" box.
Second you need to run the AIDA64_exporter that can be found here: https://gist.github.com/WoLpH/558158dd92ce08cb2253c07934a12ad8
To run the script you need Python 3 (any recent version will work) and the prometheus_client Python package.
You can start the script any way you like. I personally launch the script using EventGhost.
Lastly you need to configure Prometheus to read the data from that machine at port 9091 (you can change it with commandline flags to the exporter if needed).
Data source config
Collector config:
Upload an updated version of an exported dashboard.json file from Grafana
| Revision | Description | Created | |
|---|---|---|---|
| Download |
Windows
Easily monitor your deployment of the Windows operating system with Grafana Cloud's out-of-the-box monitoring solution.
Learn more


