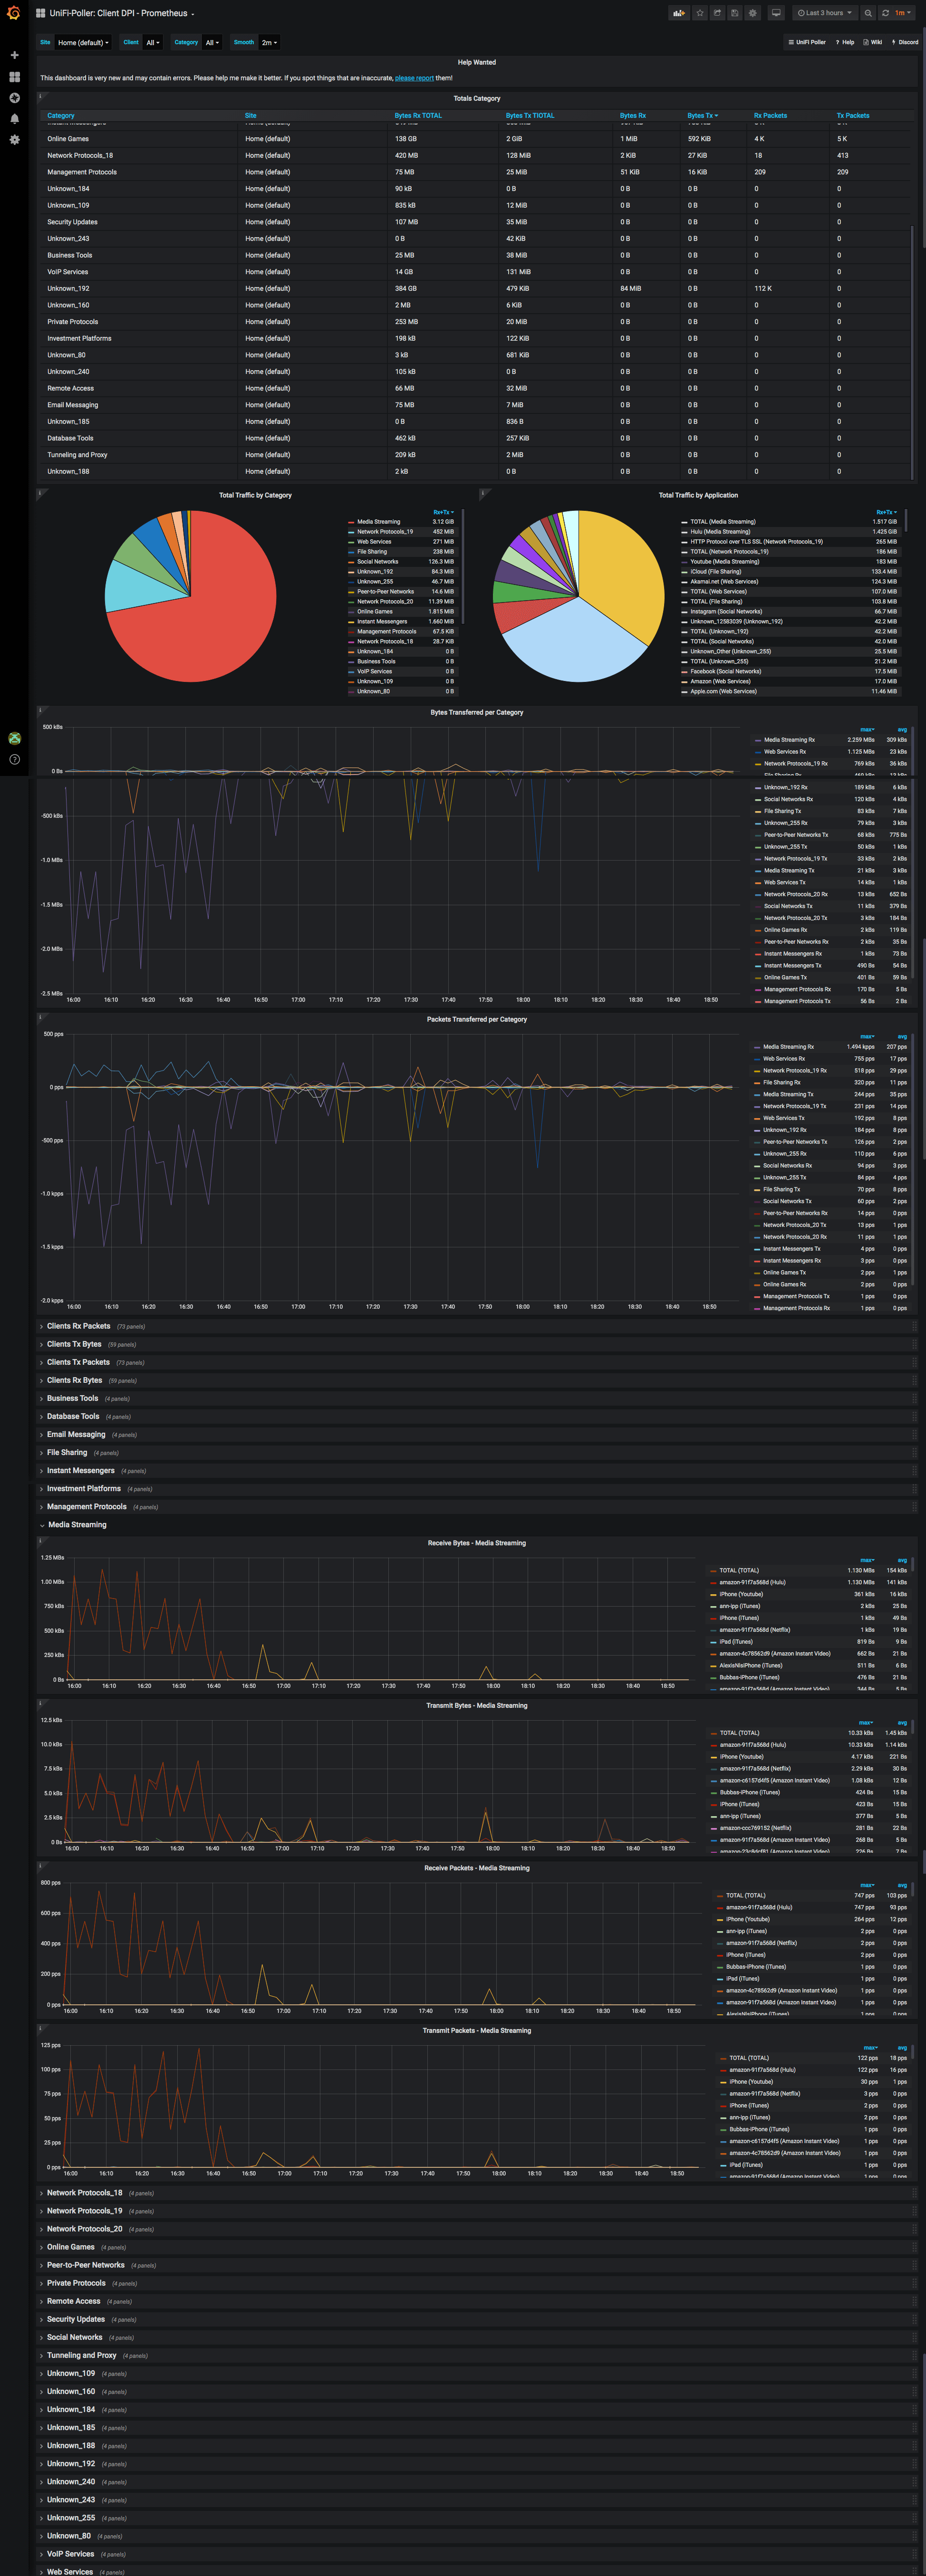
UniFi-Poller: Client DPI - Prometheus
UniFi Poller v2.0.1 Displays DPI information for clients in a UniFi network using Prometheus.
UniFi Client DPI: Prometheus Dashboard
If your UniFi Network has DPI enabled, you want to get this dashboard. This dashboard displays detailed information for packet-inspected client traffic found in a UniFi controller.
The dashboard is multi-site capable. The data displayed is stored in InfluxDB by Unifi Poller. This is one of several UniFi Poller dashboards. Click this link to see them all.
UniFi Poller is a small Golang application that runs on Windows, FreeBSD, macOS, Linux or Docker. It polls a UniFi controller every 30 seconds for measurements and stores the data in an Influx database. A small setup with 2 APs, 1 switch, 1 gateway and 40 clients produces over 3000 fields (metrics).
More
Ubiquiti makes networking devices like switches, gateways (routers) and wireless access points. They have a line of equipment named UniFi that uses a controller to keep stats and simplify network device configuration. This controller can be installed on Windows, macOS and Linux. Ubiquiti also provides a dedicated hardware device called a CloudKey that runs the controller software.
Data source config
Collector config:
Upload an updated version of an exported dashboard.json file from Grafana
| Revision | Description | Created | |
|---|---|---|---|
| Download |
Metrics Endpoint (Prometheus)
Easily monitor any Prometheus-compatible and publicly accessible metrics URL with Grafana Cloud's out-of-the-box monitoring solution.
Learn more

