Node Exporter Dashboard EN 20201010-StarsL.cn
【English version】Update 2020.10.10, add the overall resource overview! Support Grafana6&7,Support Node Exporter v0.16 and above.Optimize the main metrics display. Includes: CPU, memory, disk IO, network, temperature and other monitoring metrics。https://github.com/starsliao/Prometheus
Grafana v6.7.4/v7.2.0 + node_exporter 1.0.1 test pass
If you are using grafana 6.x, please download and edit the json file, replace table-old with table, and then import it into grafana.
【English version】Update 2020.10.10, add the overall resource overview! Support Grafana6&7,Support Node Exporter v0.16 and above.Optimize the main metrics display. Includes: CPU, memory, disk IO, network, temperature and other monitoring metrics。https://github.com/starsliao/Prometheus
【中文版】
推荐使用【ConsulManager】来管理主机/MySQL/Redis与站点监控,自动同步云资源到Prometheus,更多惊喜!
【ConsulManager介绍】
应用场景1:如何优雅的基于Consul自动同步ECS主机监控
应用场景2:如何优雅的使用Consul管理Blackbox站点监控
应用场景3:如何把云主机自动同步到JumpServer
应用场景4:使用1个mysqld_exporter监控所有的MySQL实例
应用场景5:使用1个redis_exporter监控所有的Redis实例
Important update:
Newly added data source variable
origin_prometheus, taken from the external system label of Prometheus:external_labelscan be used to support multiple scenarios where Prometheus accesses to VictoriaMetrics or Thanos and other third-party storage to use theremote_writemethod. (No value by default, the absence of this label in the indicator does not affect the use)VictoriaMetricsplease use v1.42.0 and above versions, which fixed the problem of displaying the grafana table.Added the time interval variable
interval, all graphs are associated with this variable, and the granularity of the graph can be adjusted by selecting the time interval as needed. Note that thescrape_intervalprometheus.yml. If there are less than 2 values in theratetime interval, the graph cannot be displayed. When it is equal to 2 values,rateisirate.(The default time interval is set to 2 minutes. If your Prometheusscrape_intervalis greater than 1 minute, the graph will not be displayed. Just choose a larger time interval.)
Compatibility Release Notes:
If you import the dashboard, you get an error:
Failed create dashboard model
Cannot read property 'Symbol(Symbol.iterator)' of undefined
Note that your grafana version is too low, does not support the new BAR GAUGE chart, it is recommended to upgrade to the latest version of grafana, or re-import version without BAR GAUGE:
https://grafana.com/grafana/dashboards/11173
Blog:StarsL.cn
GitHub:https://github.com/starsliao/Prometheus
Screenshots:
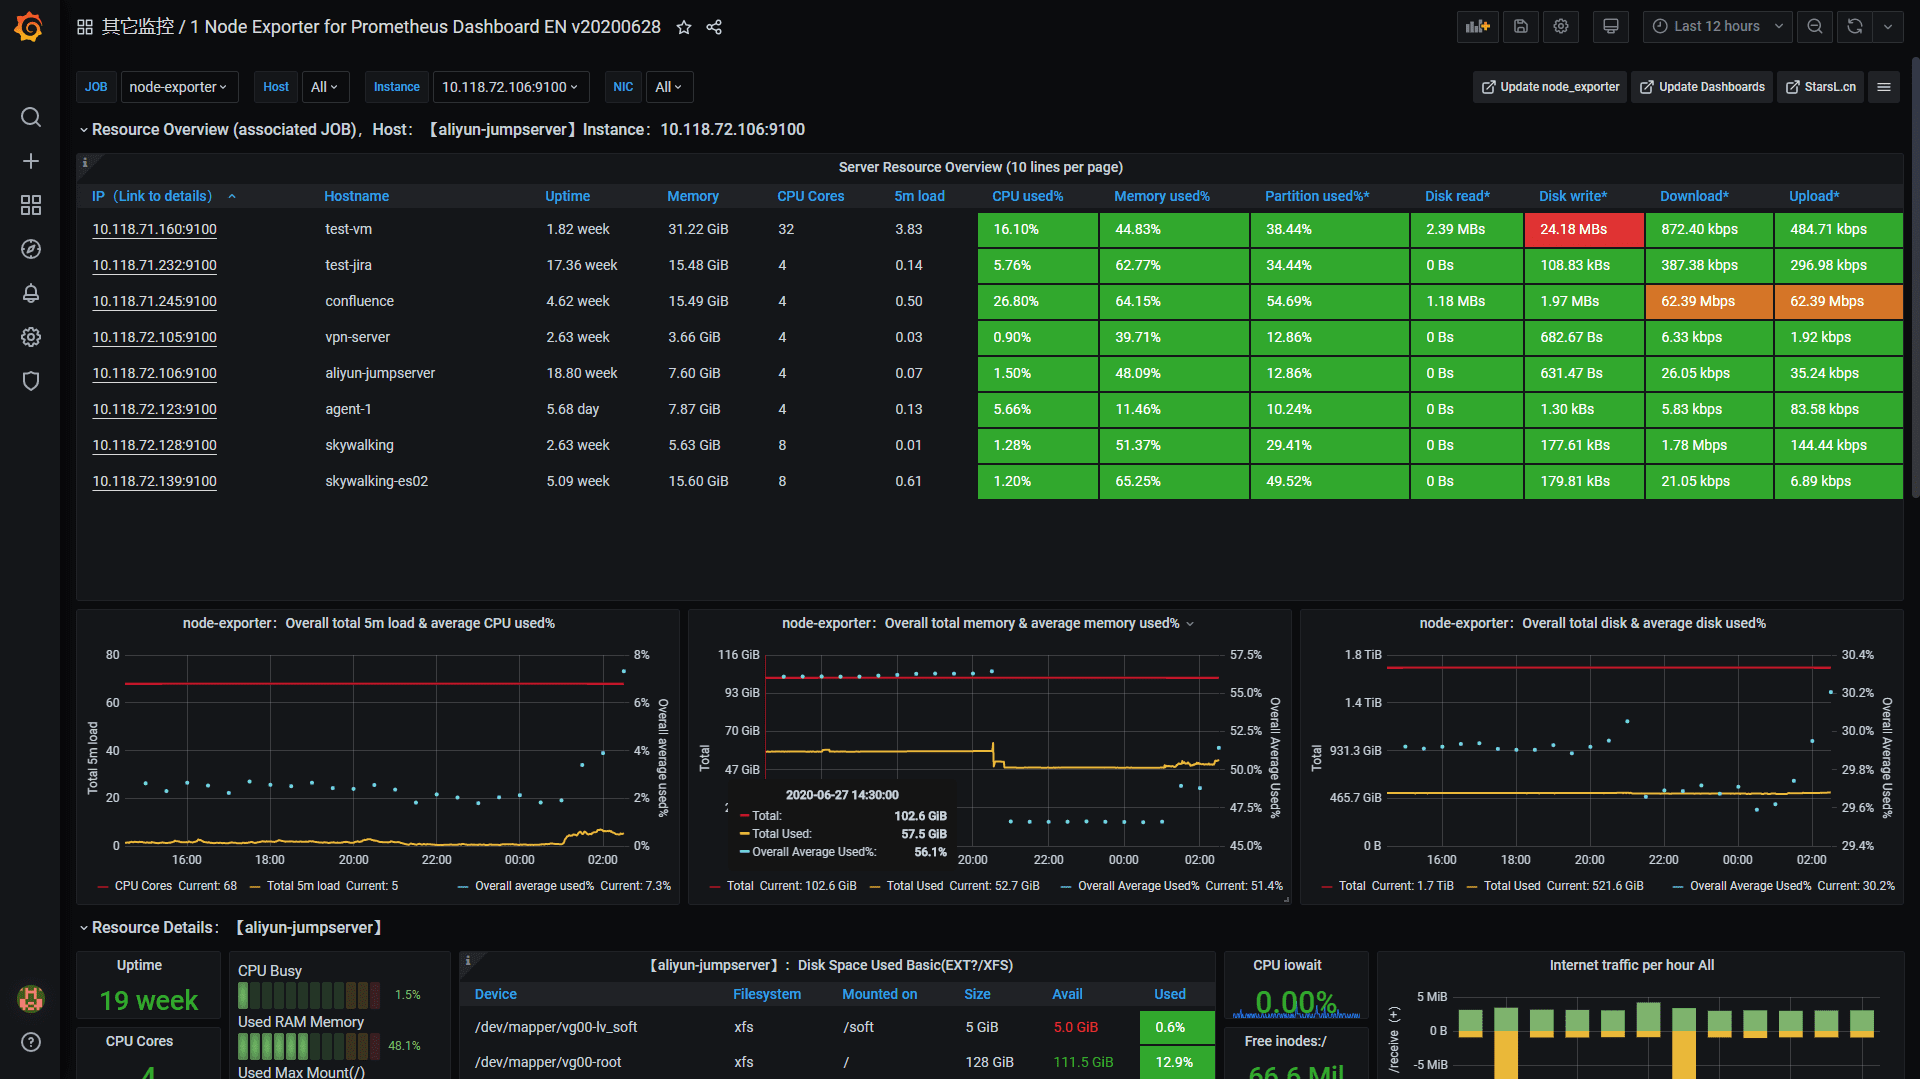
Resource Overview
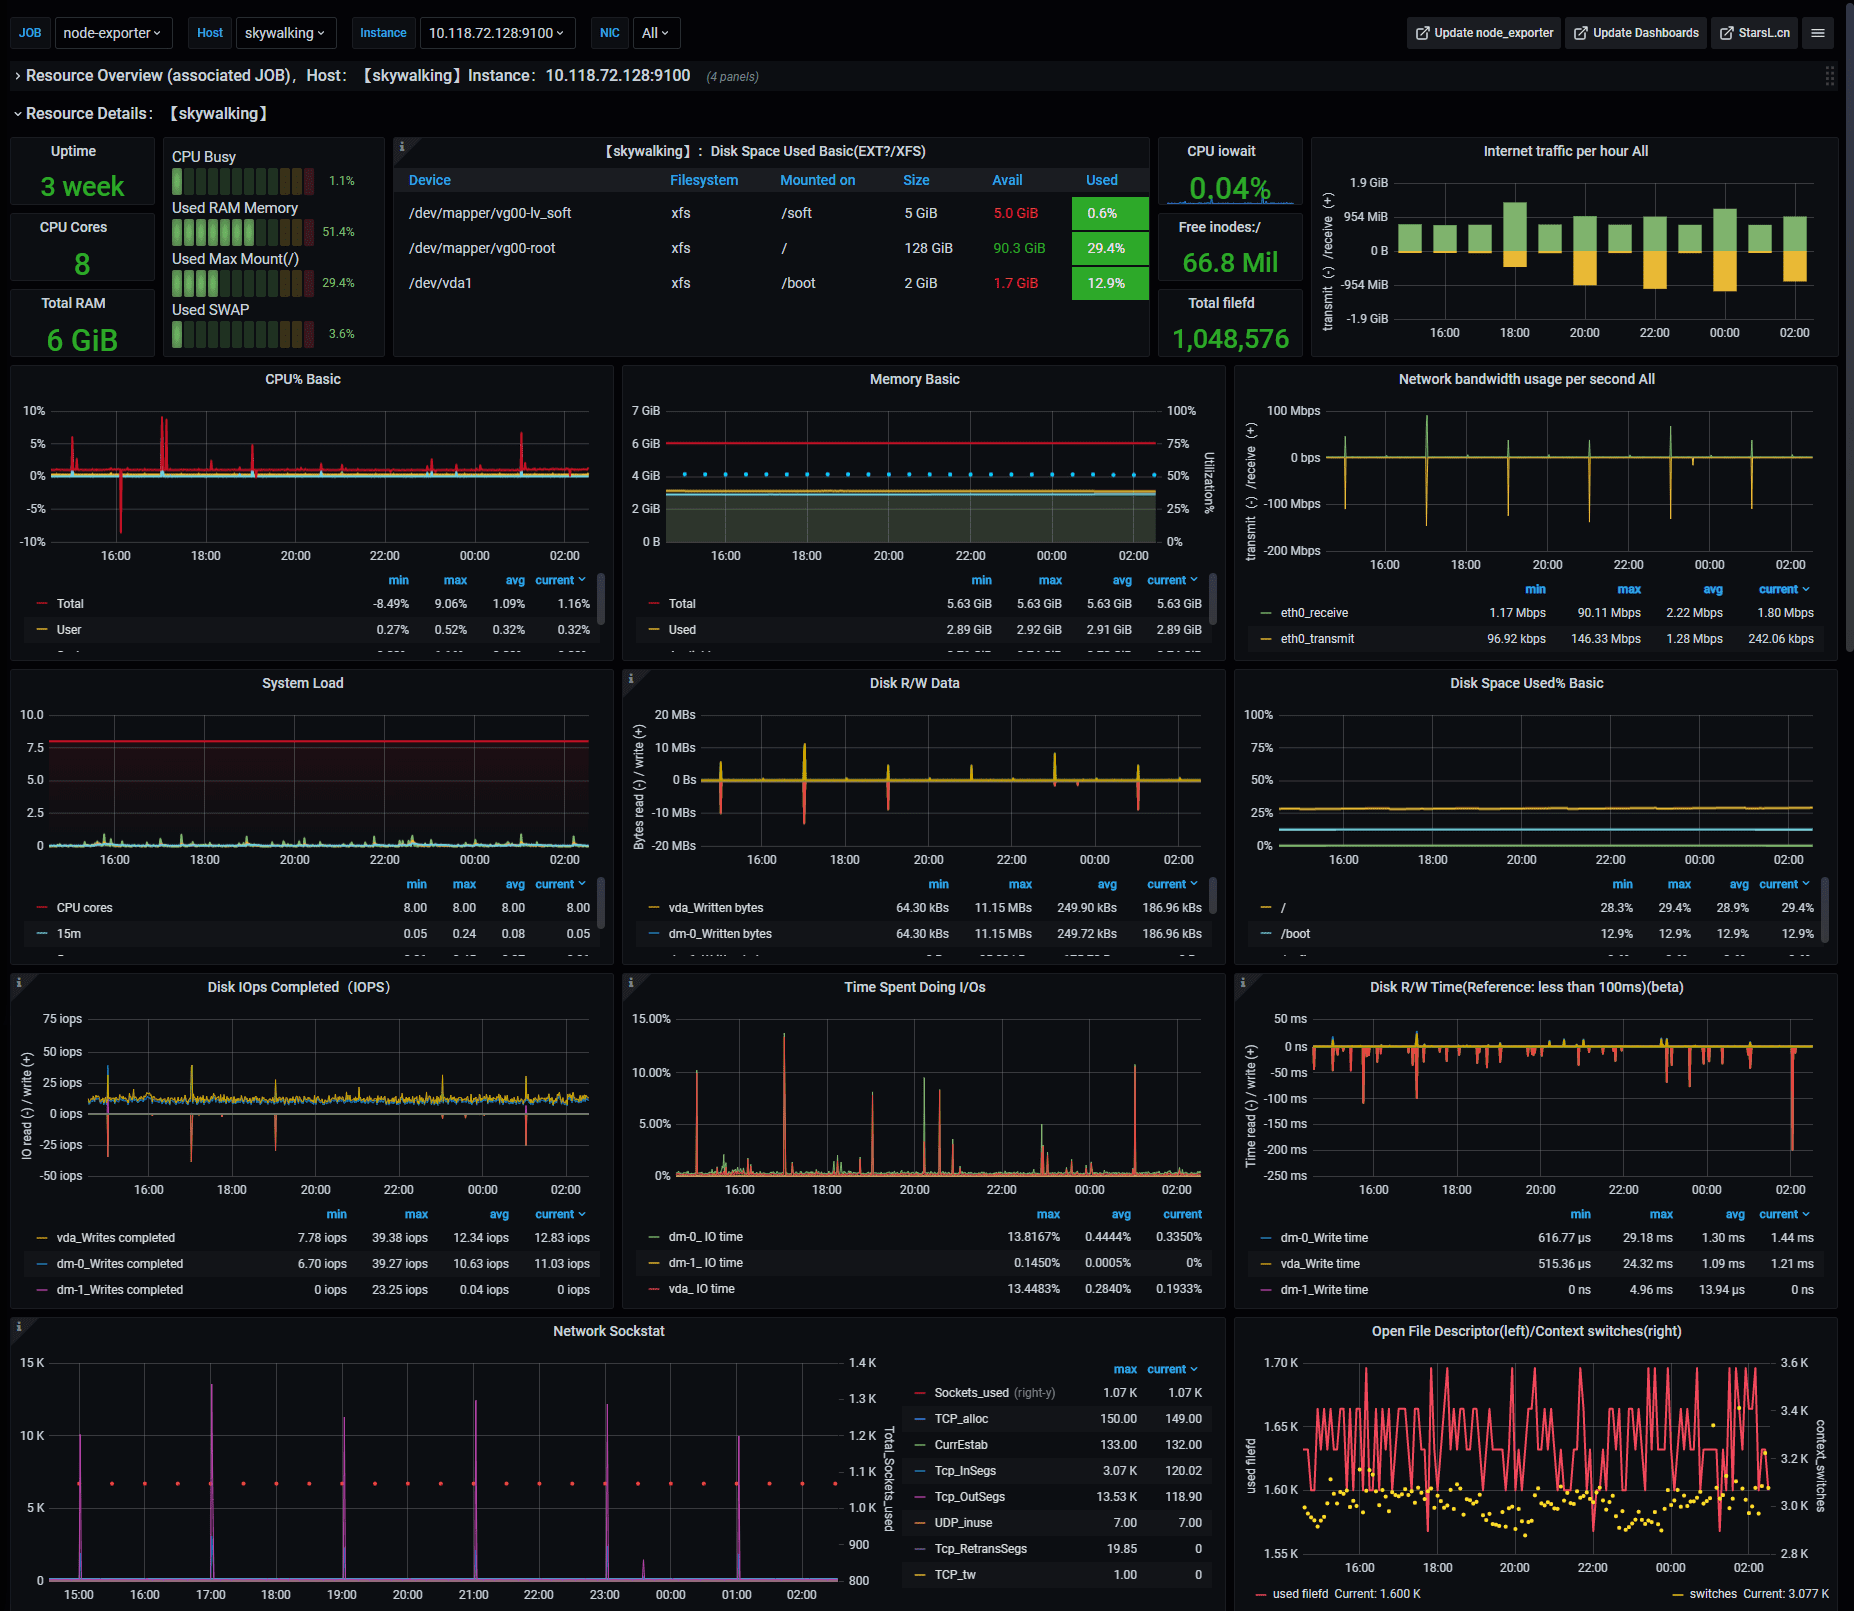
 Resource Details

Notes:
After import the dashboard, please click Dashboardsettings-- Variables to set the variable in the upper right corner of the dashboard according to the actual situation。
The three variables:$job, $hostname and $node will be set and associated by default.
$nodetakes theinstanceof node_exporter,ip:portformat. Most queries are associated with this variable, please make sure it is valid.$maxmountis used to check the maximum partition of the current host. Normally can only obtain partitions of typeext.*andxfsby default.
【update】:
2020/10/10
- The
origin_prometheusvariable removed ALL to solve the problem of no data after clicking the link in the summary table.
2020/10/03
- Added 5-minute load, TCP connection number, timewait number, and total number of hosts to the resource overview table, and removed paging.
- Fixed the problem of links to resource details in the resource overview table.
- Replace all
irateto berate, increased the time interval variable, and can self-control the graph granularity. For more details, please refer to the description of Important Update as above. - Added data source variables to support multiple Prometheus. For more details, please refer to the description of Important Update as above.
- Modified the description of the resource overview chart. Move the mouse to
iin the upper left corner of the table to view it.
2020/06/27
- Added a 5-minute load value to the table on the resource overview page.
- Adjusted the resource details link of the resource overview page, you can switch the details of each host in the current window.
- Adjusted the options of the variable menu, Instance multi-selection can view multiple hosts at the same time on the detail page.
- The node_exporter 1.0.1 test is used normally.
2020/05/30
- Added table details of overall host resources conditions and statistical graphs of overall host resources. The default contraction, can be grouped by Job, can be directly linked to the specified host details. (Pls refer to screenshot)
- Cancelled the graph of the host temperature, and increased the chart of the per hour flow rate.
- Corrected the calculation of the disk usage rate to be consistent with the algorithm of the
dfcommand. - Optimized the calculation time value of some charts, speeded up the loading speed, and adjusted the display effect and position of some chart curves.
2019/11/2
- Adjusted the display metrics and descriptions of the Network Sockstat to make it more practical.
- Modified the display and description of the
node_disk_io_time_seconds_totalmetrics. - Add the reference value to the chart for each I/O read/write time-consuming.
- Optimized the display effect of part graph, fixed the color of some lines.
2019/10/30
- The pie chart that needs to be manually installed was removed, and the pie chart of the original disk information is integrated into the disk table information.
- Add a Bar Gauge to timely display the information such as cpu,memory , etc.
- Add a graph to turn on context switching and opening files.
- To separate the
Time Spent Doing I/Osfrom the cpu usage graph. - Most of the charts in the entire dashboard have been adjusted and optimized to enhance the practicality and compatibility.
- Fixed the issue about report error of displaying multiple server partial charts at the same time.
2019/7/1
- Add usage graph of disk partitions.
- Optimized data display effect.
2019/5/20
- Add server list multi-select support, graphs can display data of multiple servers.
- Optimized the display effect of variables.
- Optimize the description of some monitoring metrics, click the "i" in the upper left corner of the chart to view.
2019/1/9
- Fixed a bug that showed inaccurate memory usage.
- Add a link to update node_exporter and dashboard.
11/16
- Add description of the variable.
- Optimized the display speed after the new installation of the dashboard
11/15
- Add an environment to group servers.
- Add the pie chart and total disk space.
- Add the descriptor about current opened file.
- Add the description of some monitoring metrics.
- Optimized the display results of some metrics.
11/13
- Add the ratio of a graph of disk's I/O operation consuming time per second.
Data source config
Collector config:
Upload an updated version of an exported dashboard.json file from Grafana
| Revision | Description | Created | |
|---|---|---|---|
| Download |
Linux Server
Monitor Linux with Grafana. Easily monitor your Linux deployment with Grafana Cloud's out-of-the-box monitoring solution.
Learn more
