
RabbitMQ-Overview
A new RabbitMQ Management Overview
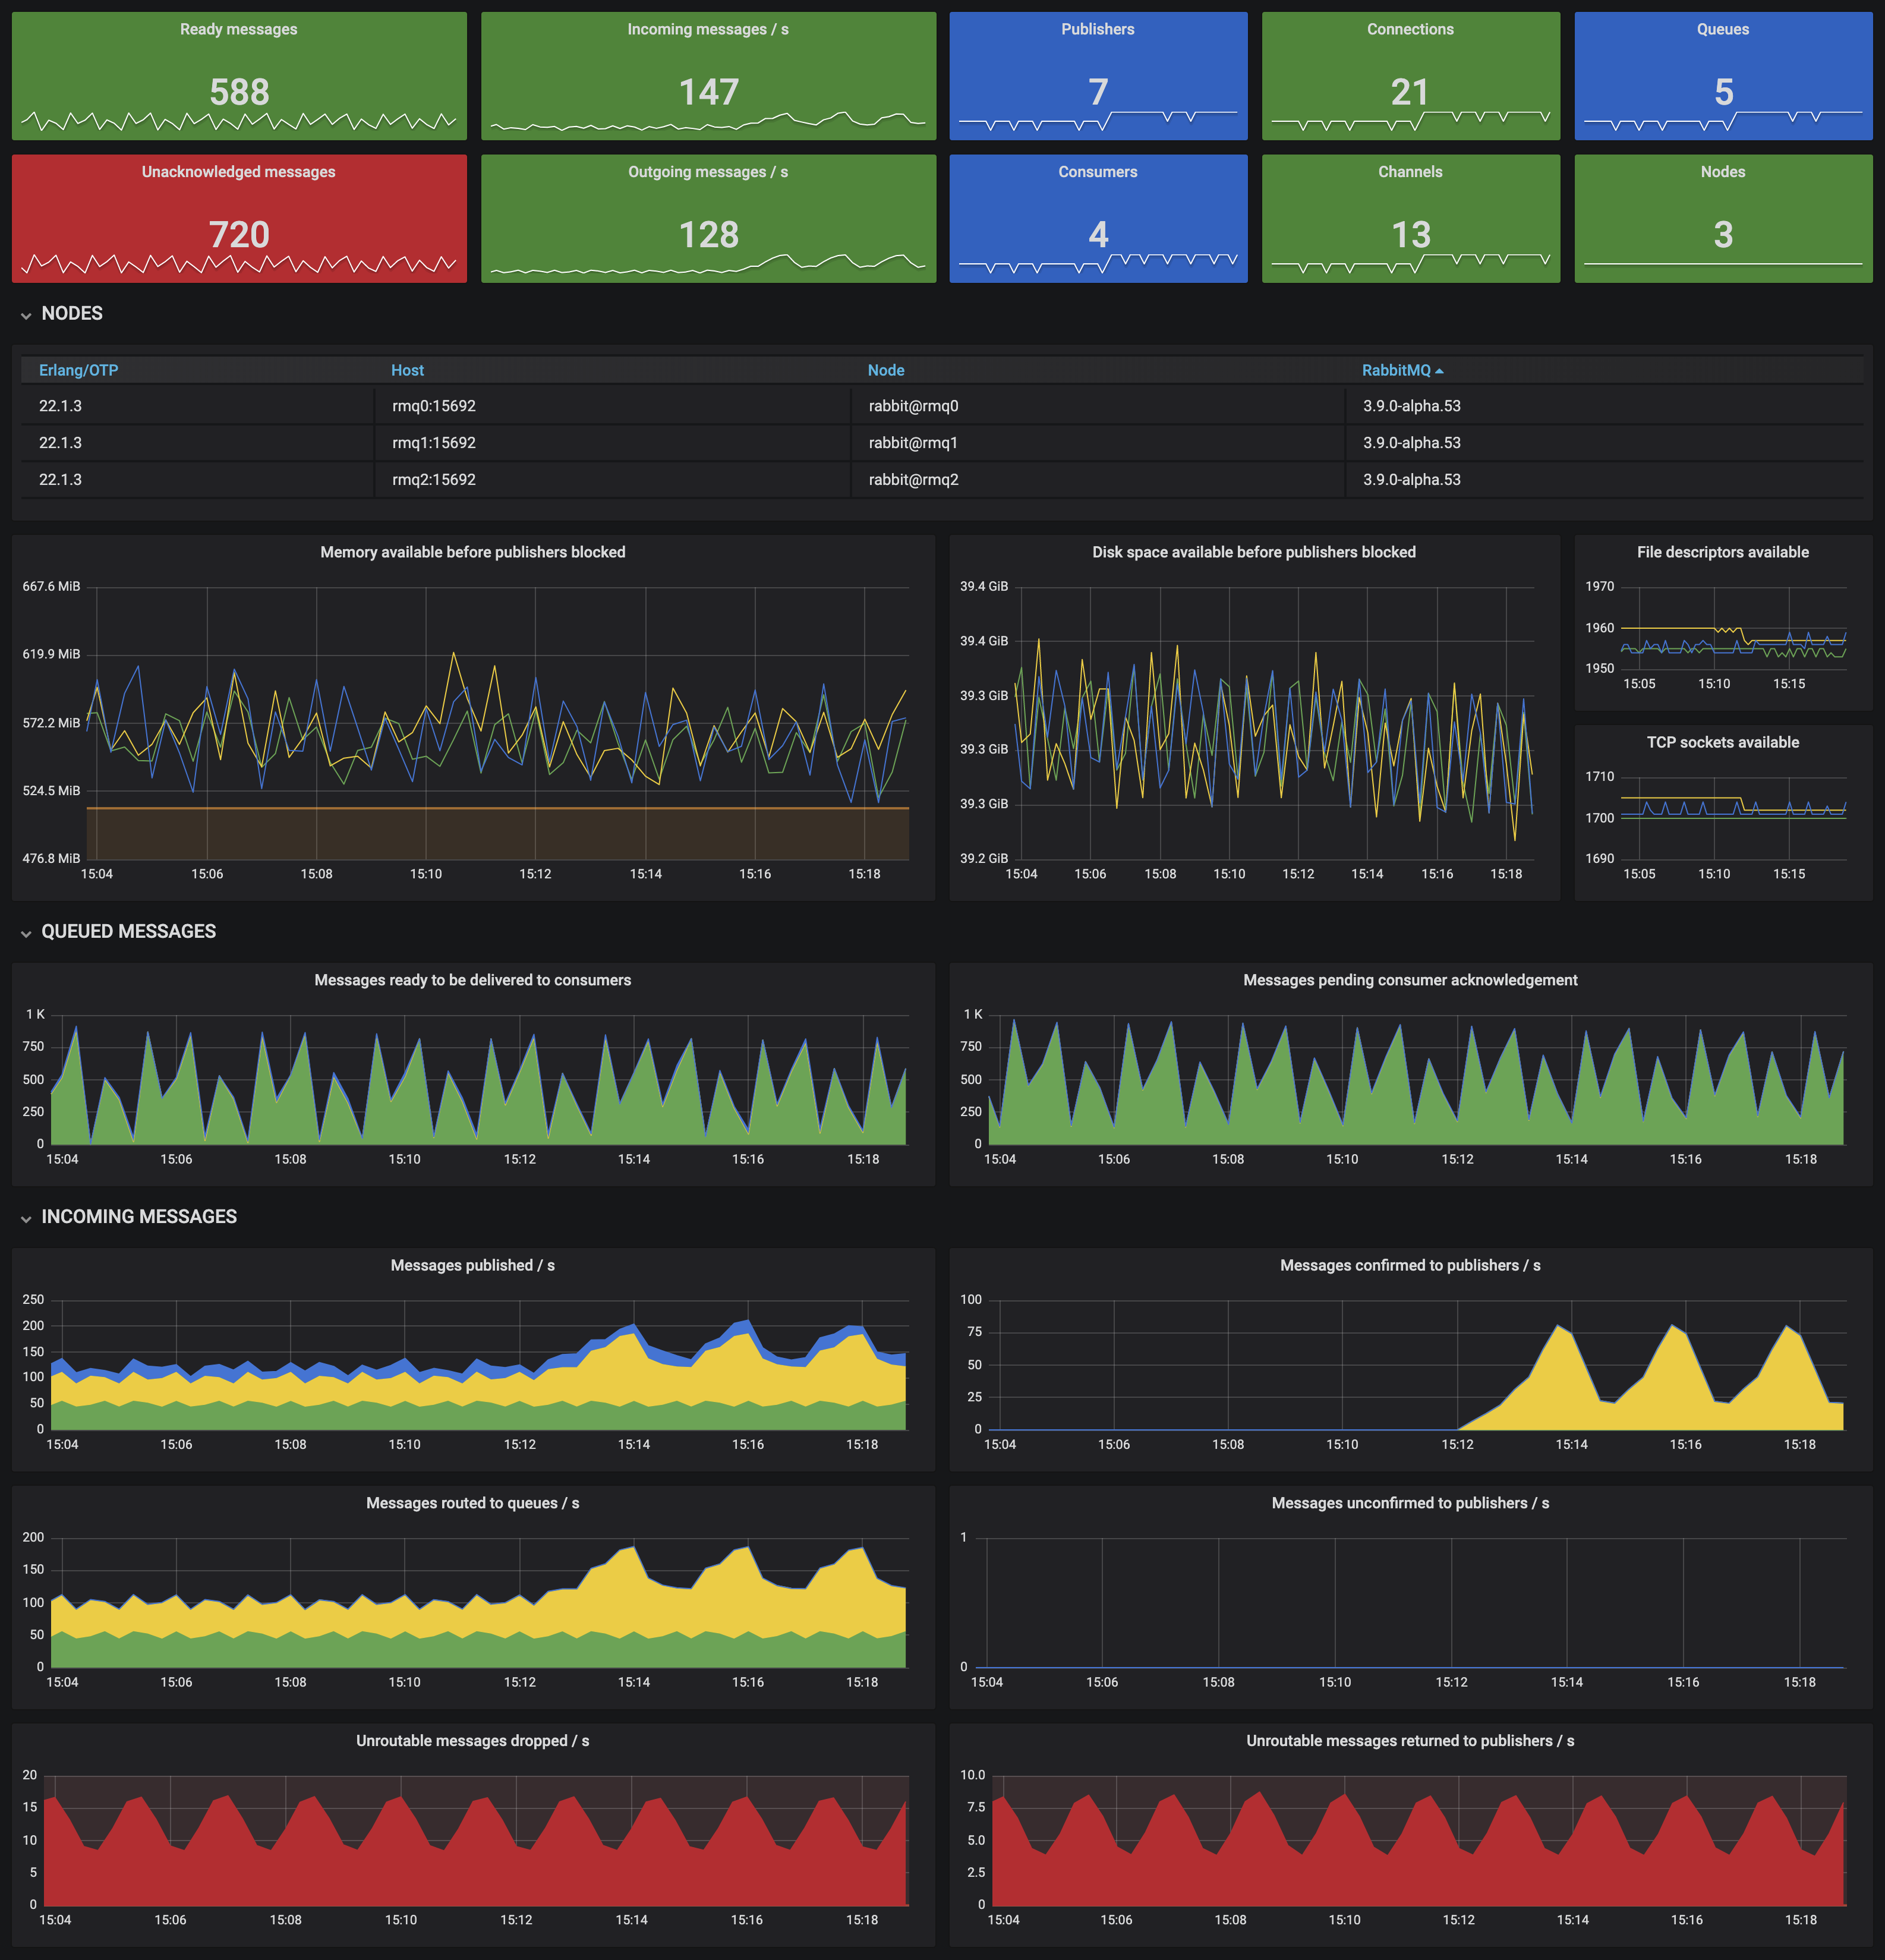
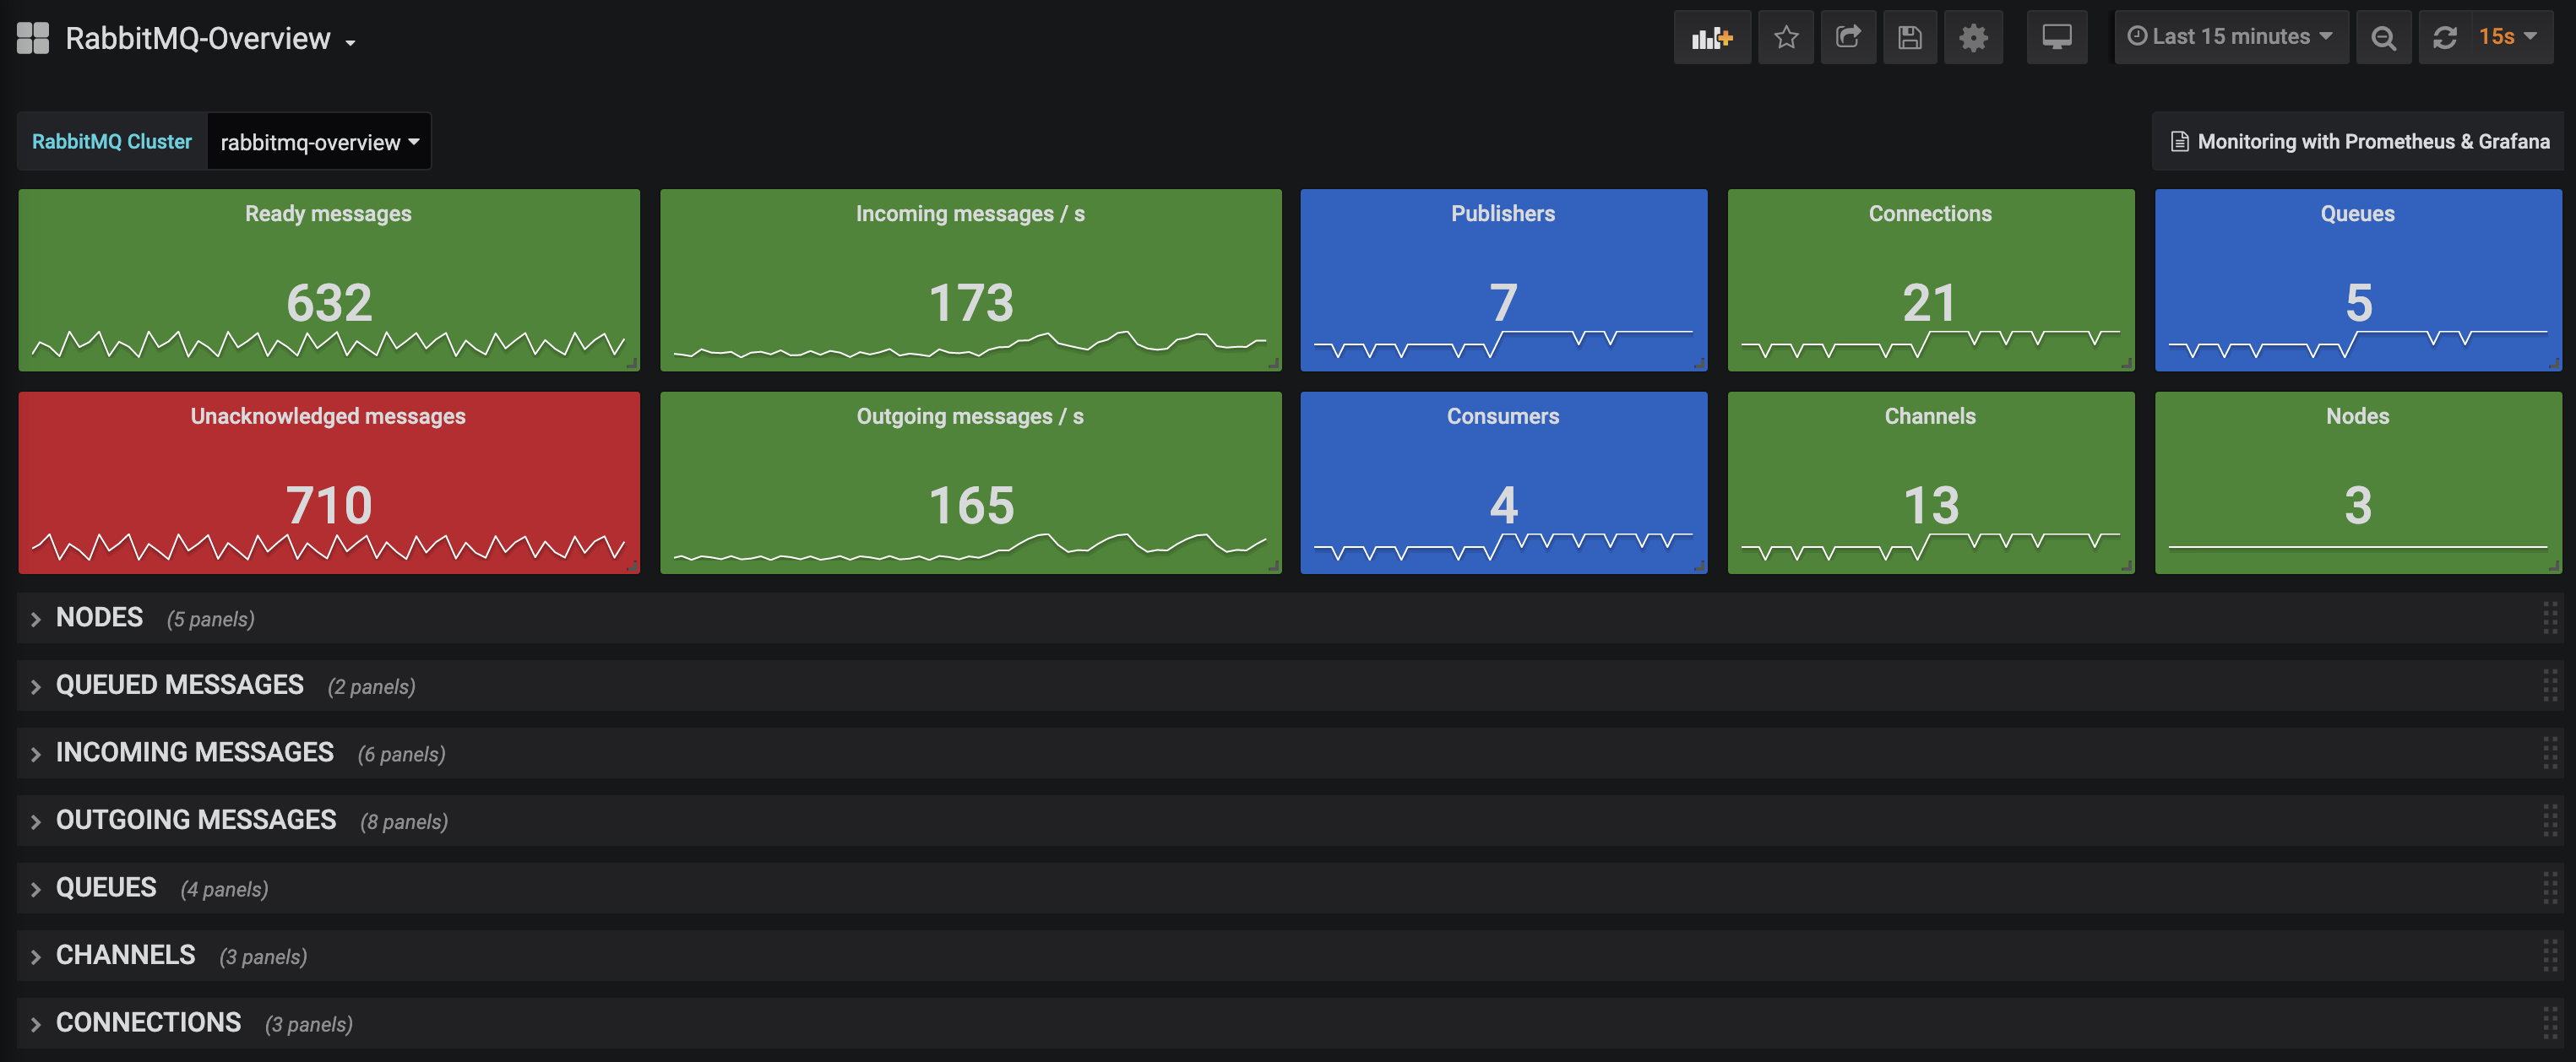
Understand the state of any RabbitMQ cluster at a glance. Includes all metrics displayed on RabbitMQ Management Overview page.
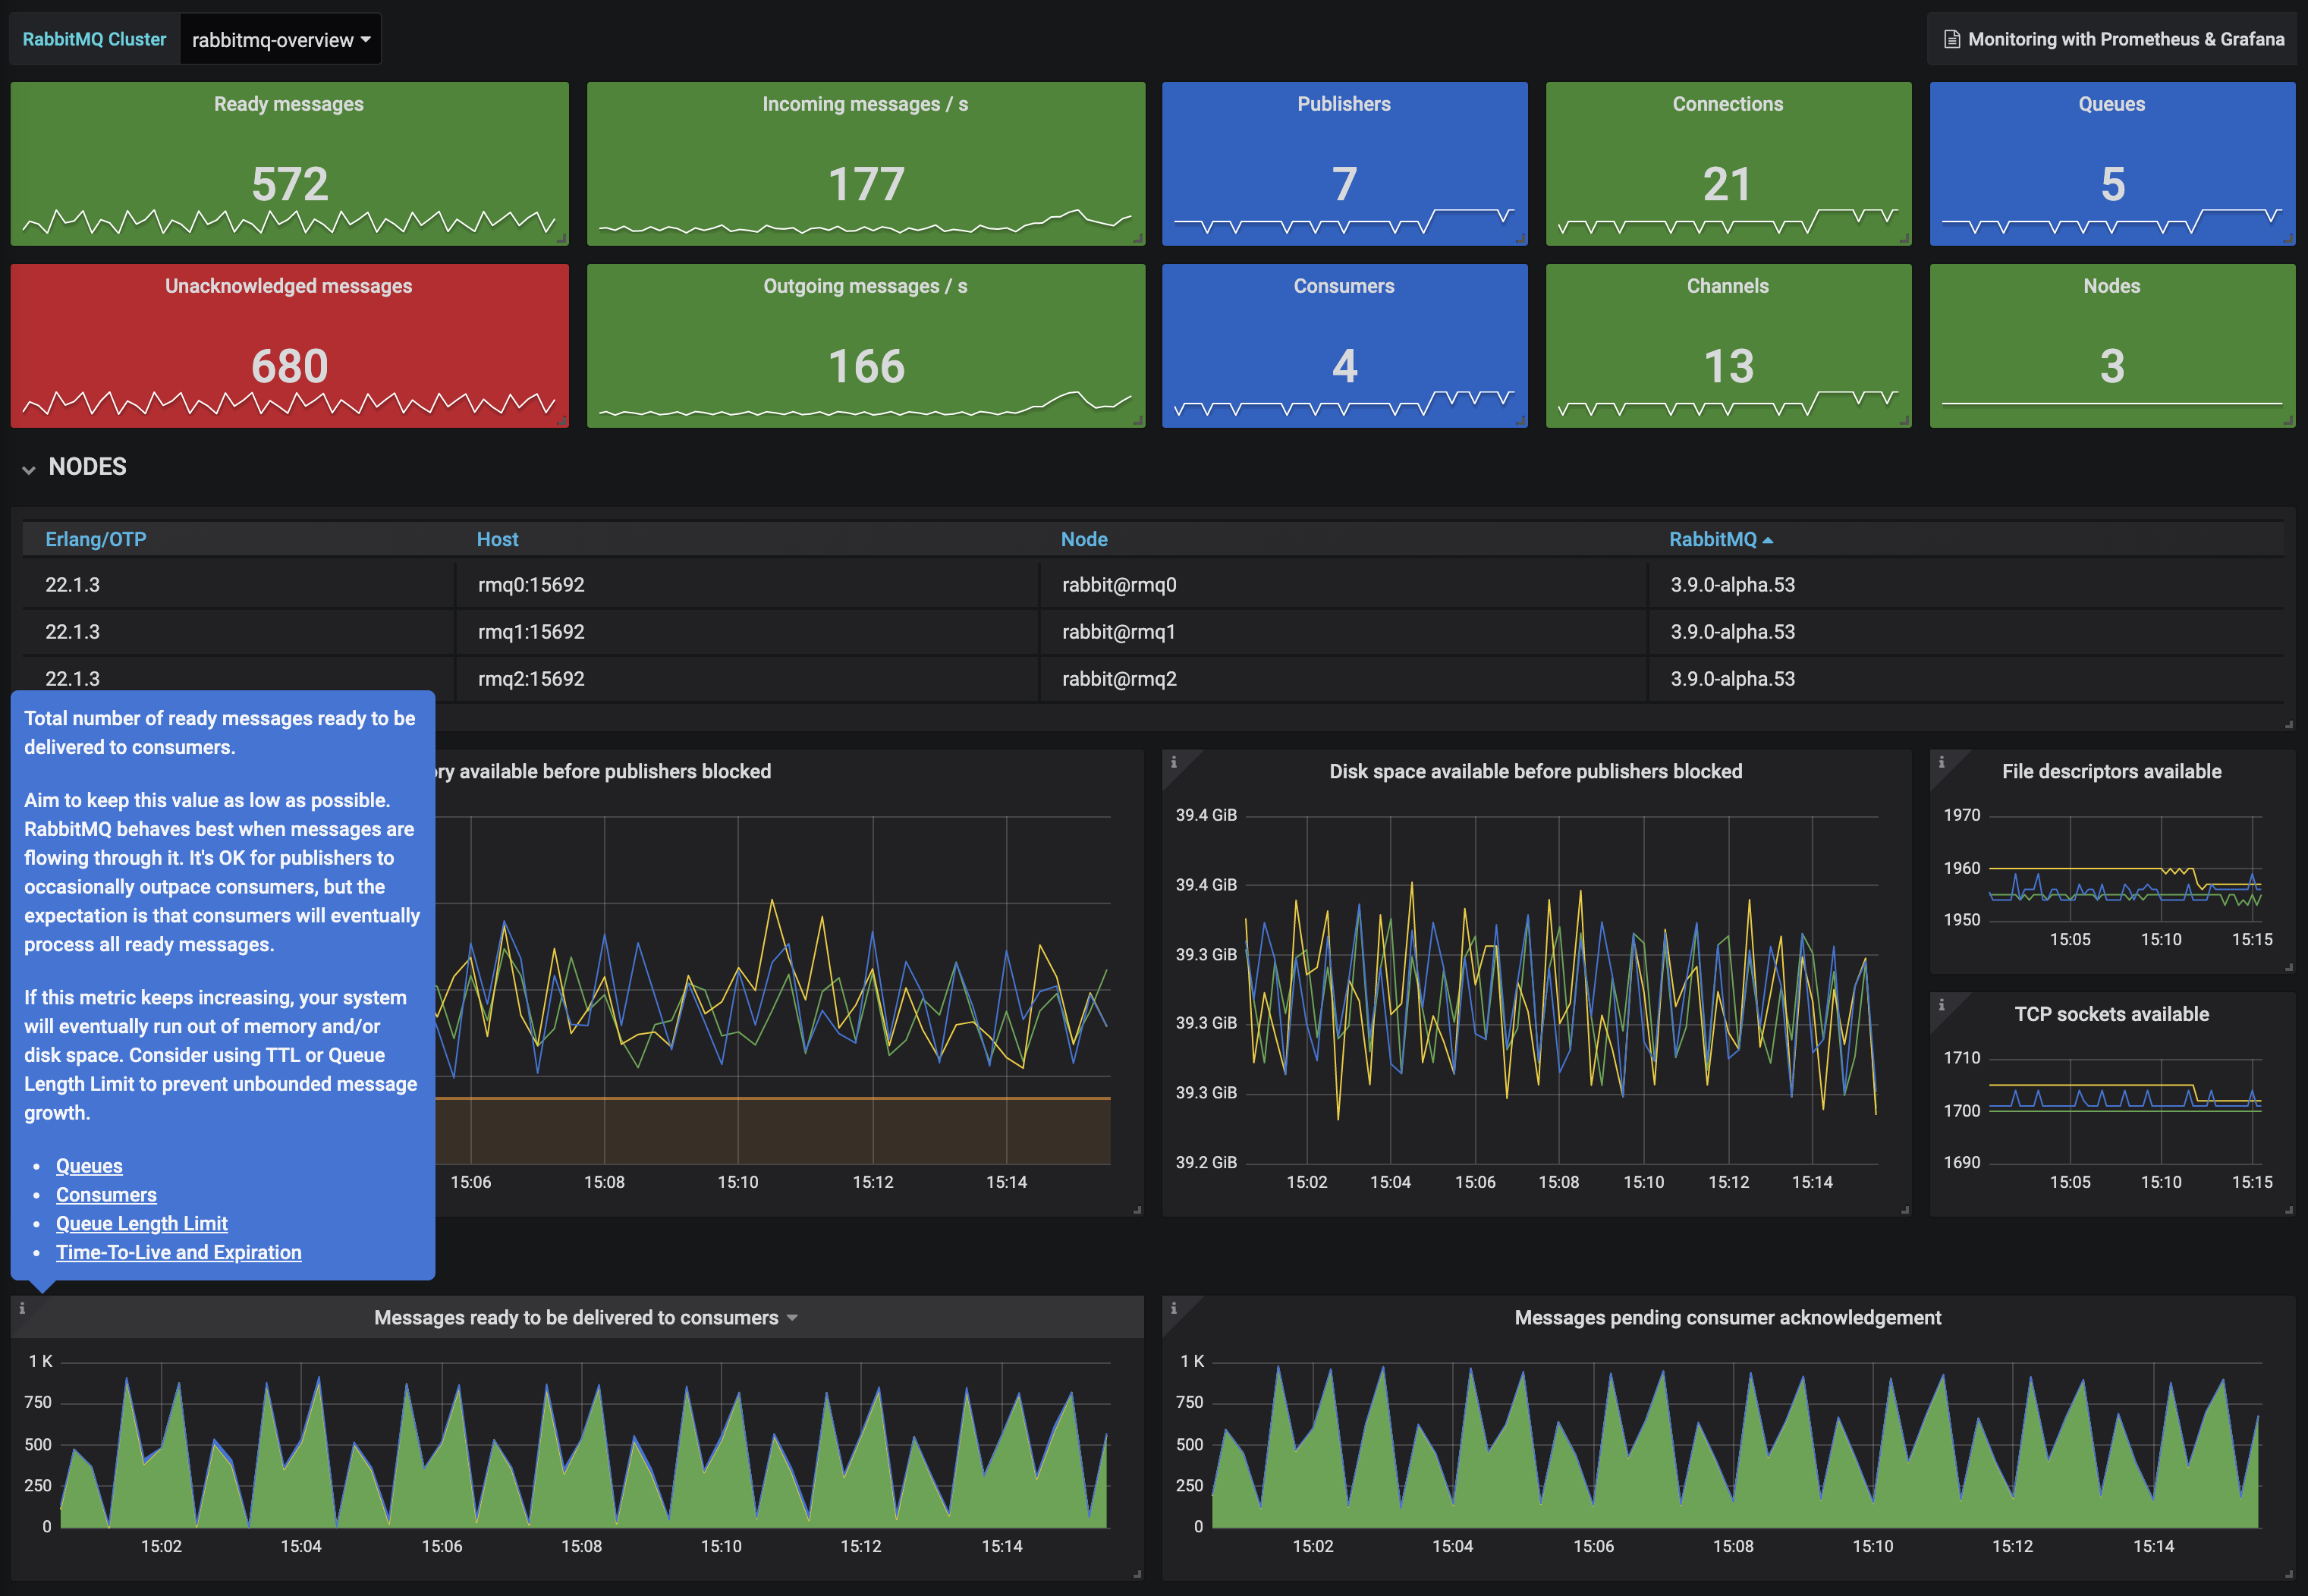
This dashboard includes detailed explanation for all metrics displayed, with links to relevant official docs and guides.
All metrics are node-specific making it trivial to visualise cluster imbalances (a.k.a. cluster hotspots).
Some graph panels include sensible default thresholds.
Metrics displayed:
- Node identity, including RabbitMQ & Erlang/OTP version
- Node memory & disk available before publishers blocked (alarm triggers)
- Node file descriptors & TCP sockets available
- Ready & pending messages
- Incoming message rates: published / routed to queues / confirmed / unconfirmed / returned / dropped
- Outgoing message rated: delivered with auto or manual acks / acknowledged / redelivered
- Polling operation with auto or manual acks, as well as empty ops
- Queues, including declaration & deletion rates
- Channels, including open & close rates
- Connections, including open & close rates
Filter by:
- RabbitMQ Cluster
Requires rabbitmq-prometheus to be enabled, a built-in plugin since RabbitMQ v3.8.0
Learn more about RabbitMQ built-in Prometheus support
To get it working locally with RabbitMQ in 3 simple steps, follow this Quick Start guide
Data source config
Collector config:
Upload an updated version of an exported dashboard.json file from Grafana
| Revision | Description | Created | |
|---|---|---|---|
| Download |
RabbitMQ
Easily monitor RabbitMQ, the most widely deployed open source message broker, with Grafana Cloud's out-of-the-box monitoring solution.
Learn more