
InfluxDB OSS Stats monitoring dashboard
The commonly monitored metrics from the built-in `_internal` database of InfluxDB OSS.
About this dashboard
The commonly monitored metrics from the built-in _internal database of InfluxDB OSS.
Please create new DataSource for _internal database.
Metrics
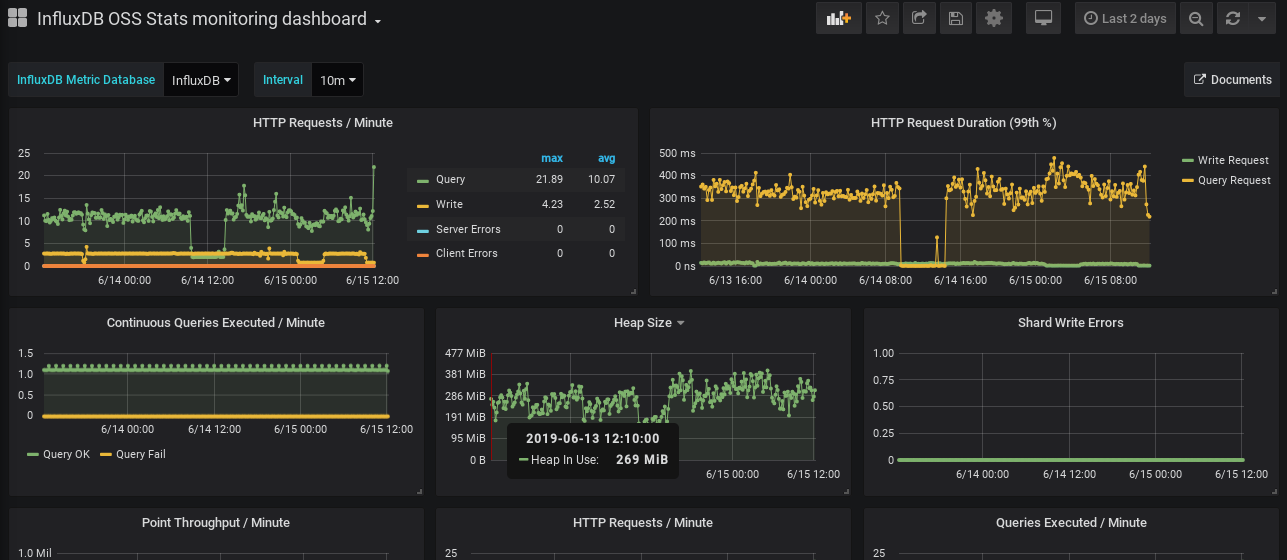
- HTTP Requests / Minute
- HTTP Request Duration (99th %)
- Continuous Queries Executed / Minute
- Heap Size
- Shard Write Errors
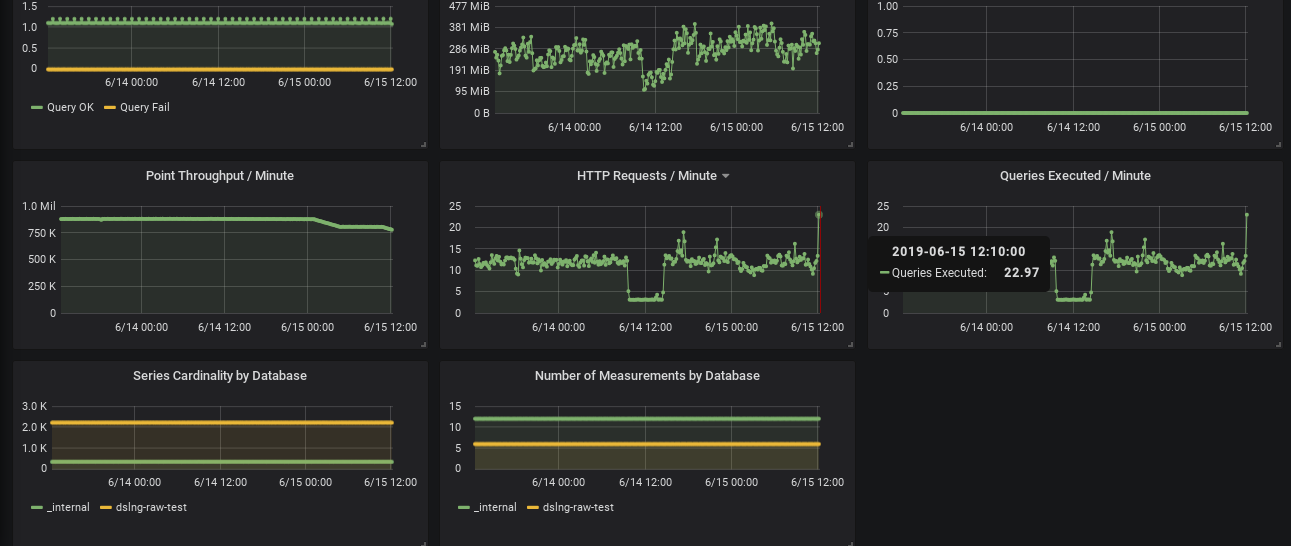
- Point Throughput / Minute by Hostname
- HTTP Requests / Minute
- Queries Executed / Minute
- Series Cardinality by Database
- Number of Measurements by Database
Setup
Create the Data Source for _internal of influxDB.
- Select Type: influxdb
- Data Source Naming with
_internal. likeInfluxDB(_internal) - InfluxDB Details:
- Database:
_internal
- Database:
History
- Rev.3
- add hostname variable.
- Rev.2
- Group with hostname and show on legend.
- Add description for each panels.
- Add link for grafana.com.
- Rev.1 Initial version.
Data source config
Collector type:
Collector plugins:
Collector config:
Revisions
Upload an updated version of an exported dashboard.json file from Grafana
| Revision | Description | Created | |
|---|---|---|---|
| Download |
InfluxDB
Easily monitor InfluxDB, an open source time series database, with Grafana Cloud's out-of-the-box monitoring solution.
Learn more