
HPE OneView Metrics
Monitor your physical infrastructure managed by HPE OneView (HPE Synergy) for servers' CPU utilization, ambient temperature and all infrastructure power consumption as well as components state.
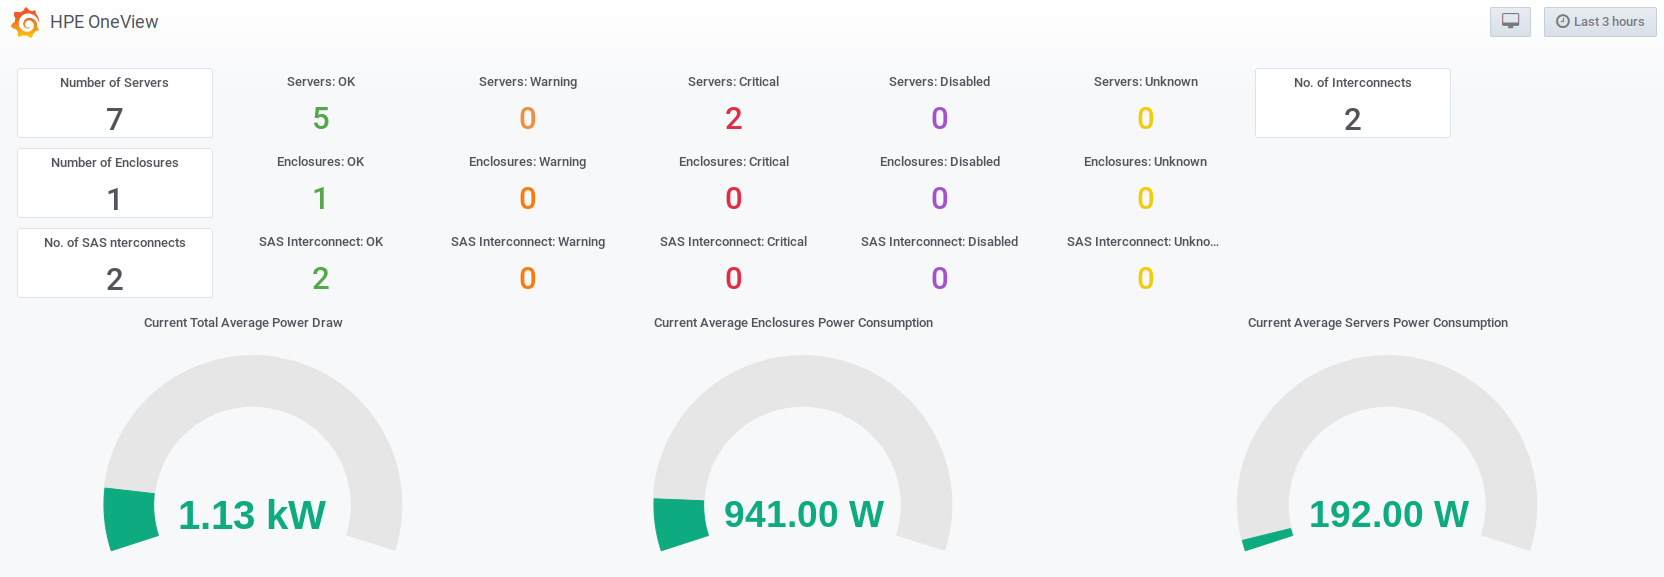
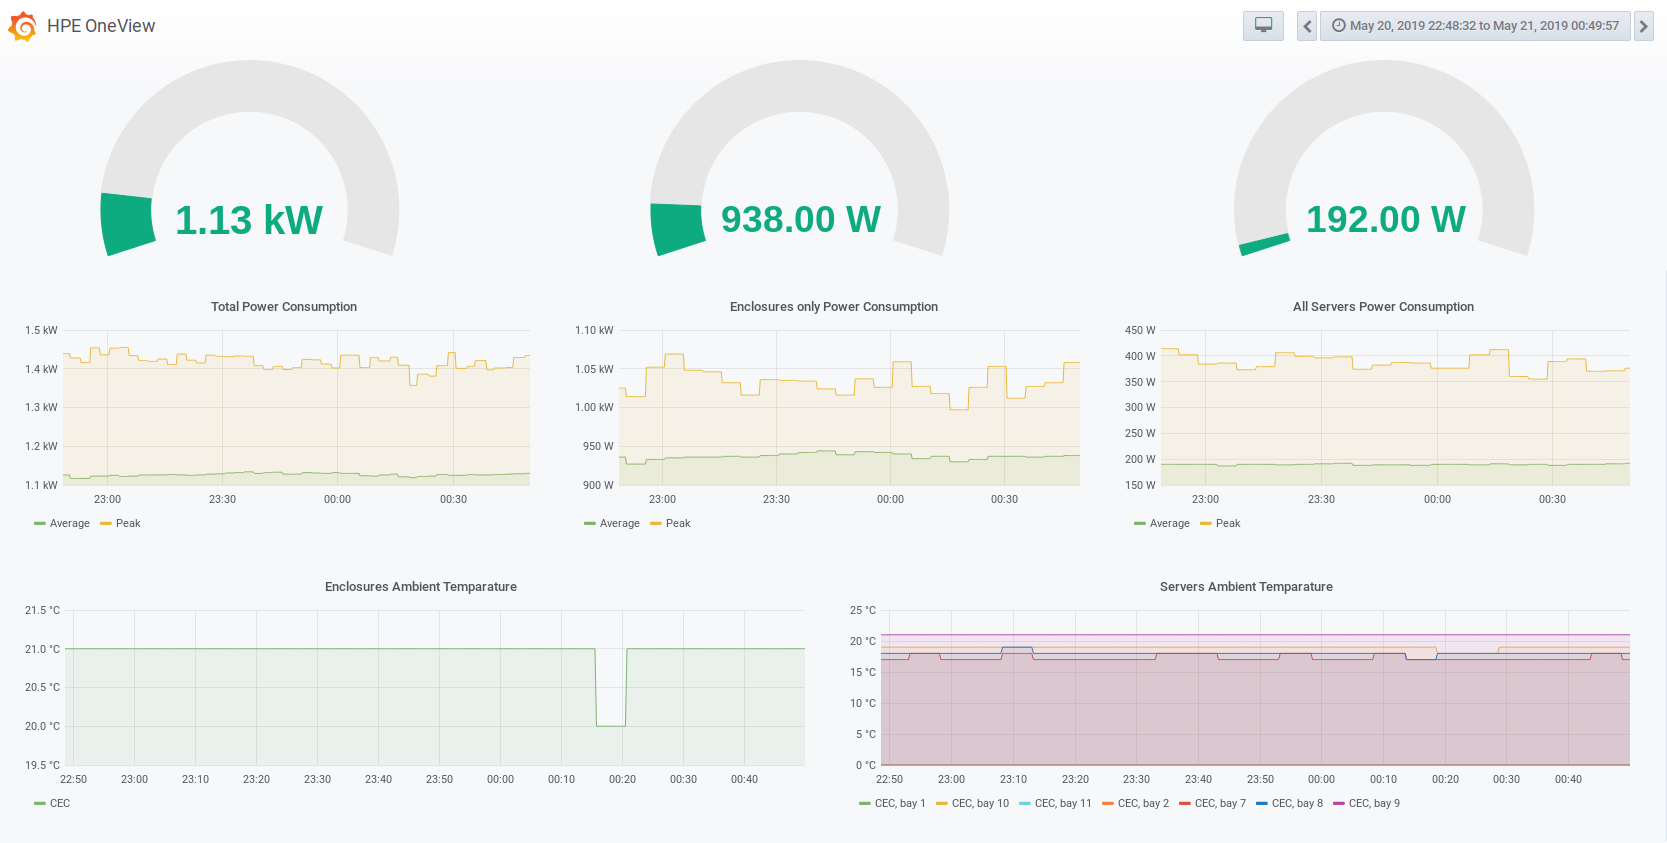
This dashbord represents physical infrastructure managed by HPE OneView (HPE Synergy) and displays state of the components (servers, enclosures, interconnect modules) as well as their environmental data like ambient temperature, power consumption as well as CPU utilization.
This dashboard requires running a custom Prometheus exporter for HPE OneView. In particular, it shows:
- Number of HPE Proliant servers managed by HPE OneView
- Number of HPE Synergy Enclosures
- For Enclosures: current and peak power consumption, ambient temperature
- For server hardware: current and peak power consumption, CPU utilization
- Operational state for server hardware, enclosures and interconnect and SAS interconnect modules
The dashboard is dynamic which means, adding/removing enclosures, interconnect modules or server server hardware will be reflected automatically.
See more at: https://github.com/mpolski/hpe-oneview-prometheus
Data source config
Collector config:
Upload an updated version of an exported dashboard.json file from Grafana
| Revision | Description | Created | |
|---|---|---|---|
| Download |