
Arista General Statistics by IP
This dashboard gives an overview about Arista network devices exposing metrics through its a OCPrometheus exporter.
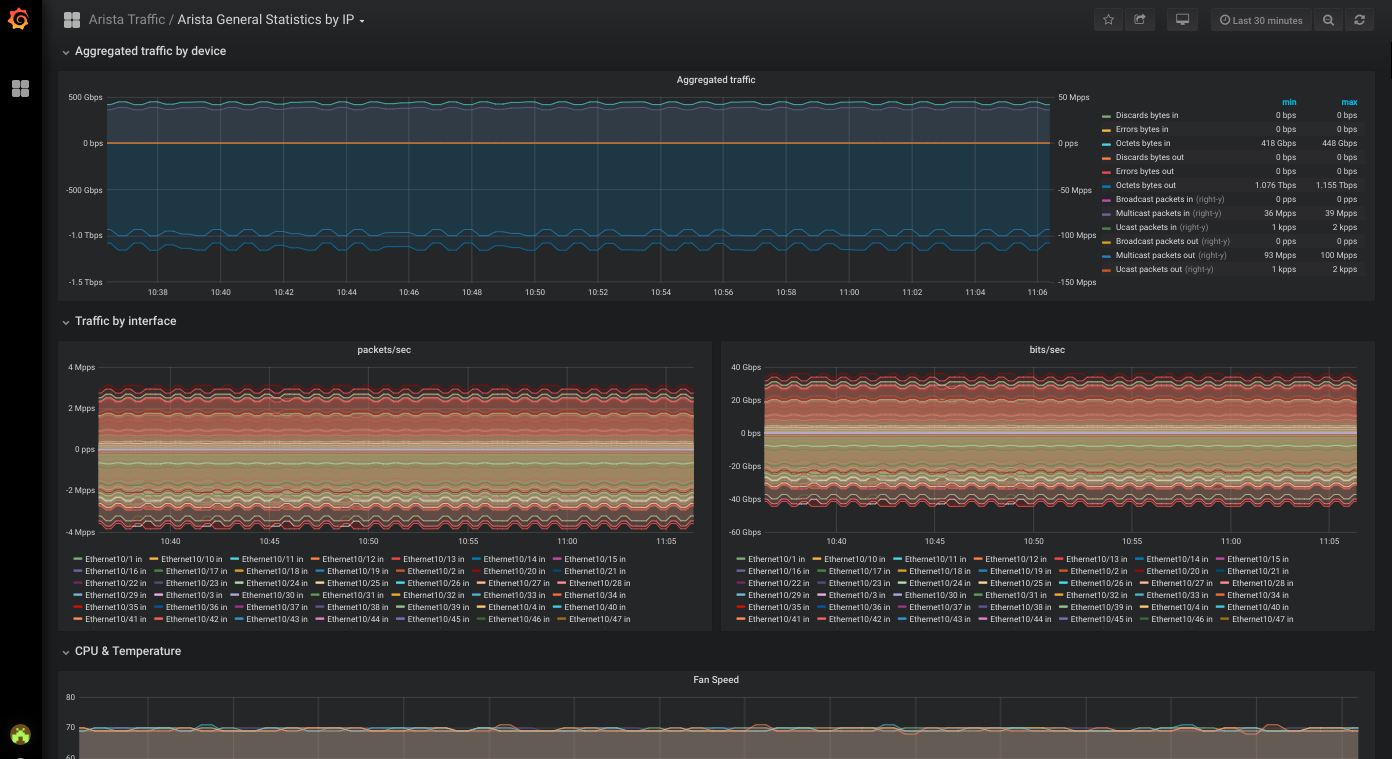
The dashboard shows the following metrics:
- Interface throughput in bits/sec
- Interface bandwidth in percentage
- Packet statistics for Errors and Discard
- Statistics about the transmitted packet types for Unicast, Multicast and Broadcast
Report source available in our Grafana Dashboard GitHub Repository.
Made by Be Smart Be Open in collaboration with Vista Technology.
See also https://github.com/besmartbeopen/dashboard-grafana-prometheus-arista
Data source config
Collector type:
Collector plugins:
Collector config:
Revisions
Upload an updated version of an exported dashboard.json file from Grafana
| Revision | Description | Created | |
|---|---|---|---|
| Download |