
Terracotta Resource Usage Dashboard
Dashboard for Prometheus metrics coming from the Terracotta Management Console Prometheus servlet. In particular : Resource Usage of a given Terracotta Cluster
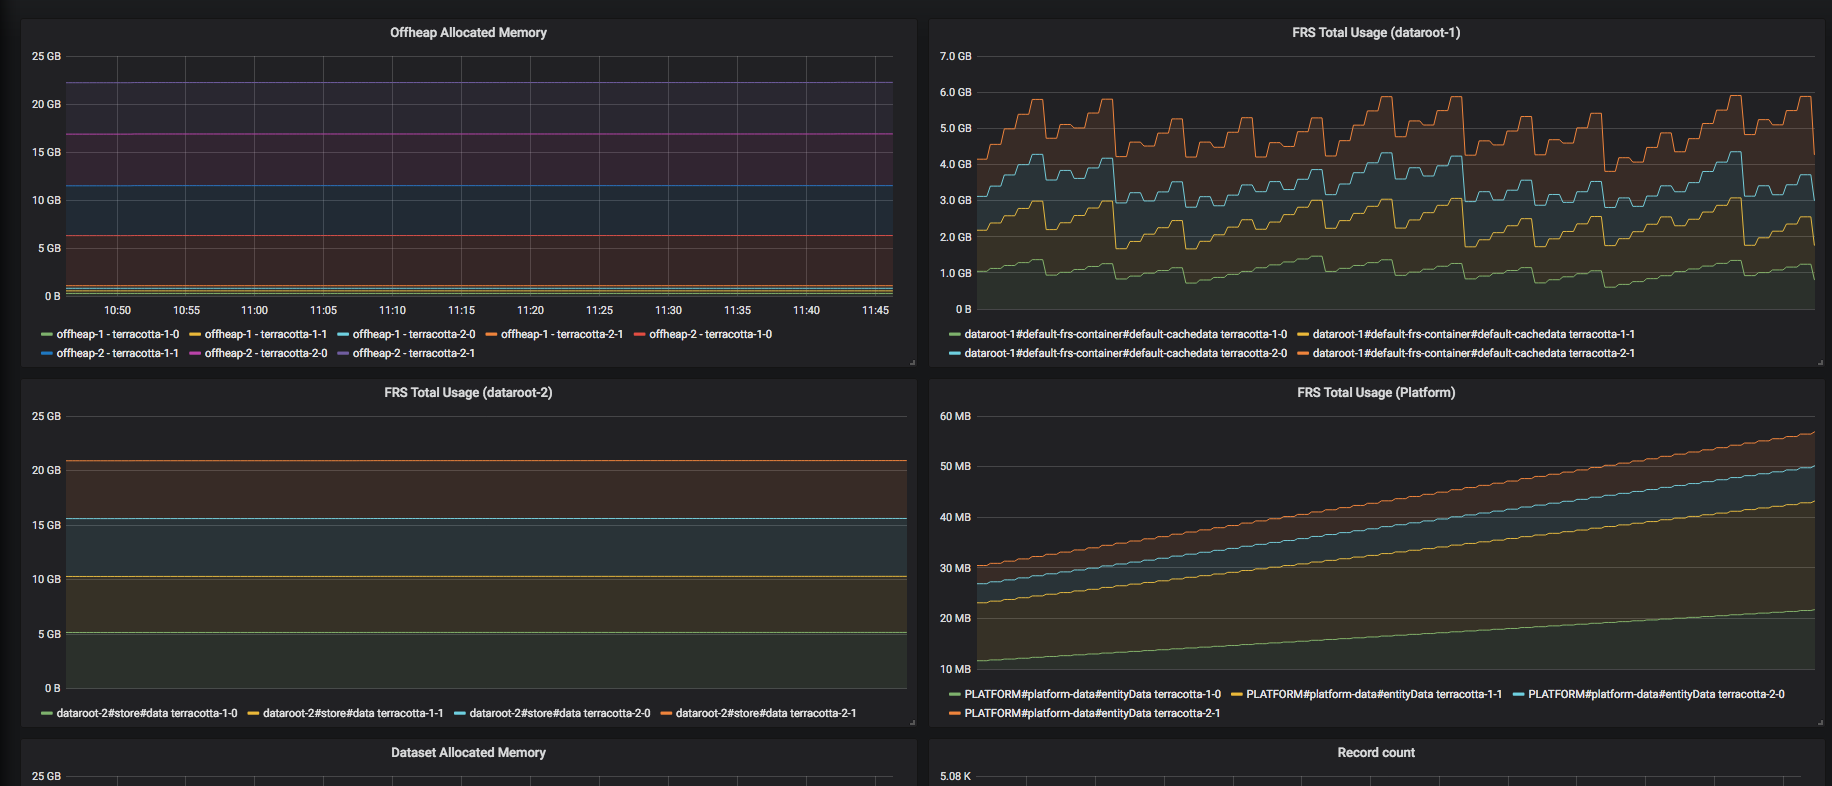
The Terracotta Resource Usage Dashboard dashboard uses the data source to create a Grafana dashboard with the graph panel.
Data source config
Collector type:
Collector plugins:
Collector config:
Revisions
Upload an updated version of an exported dashboard.json file from Grafana
| Revision | Description | Created | |
|---|---|---|---|
| Download |