
Celery Monitoring
Monitor Celery Tasks with Prometheus and celery-exporter
This dashboards provides:
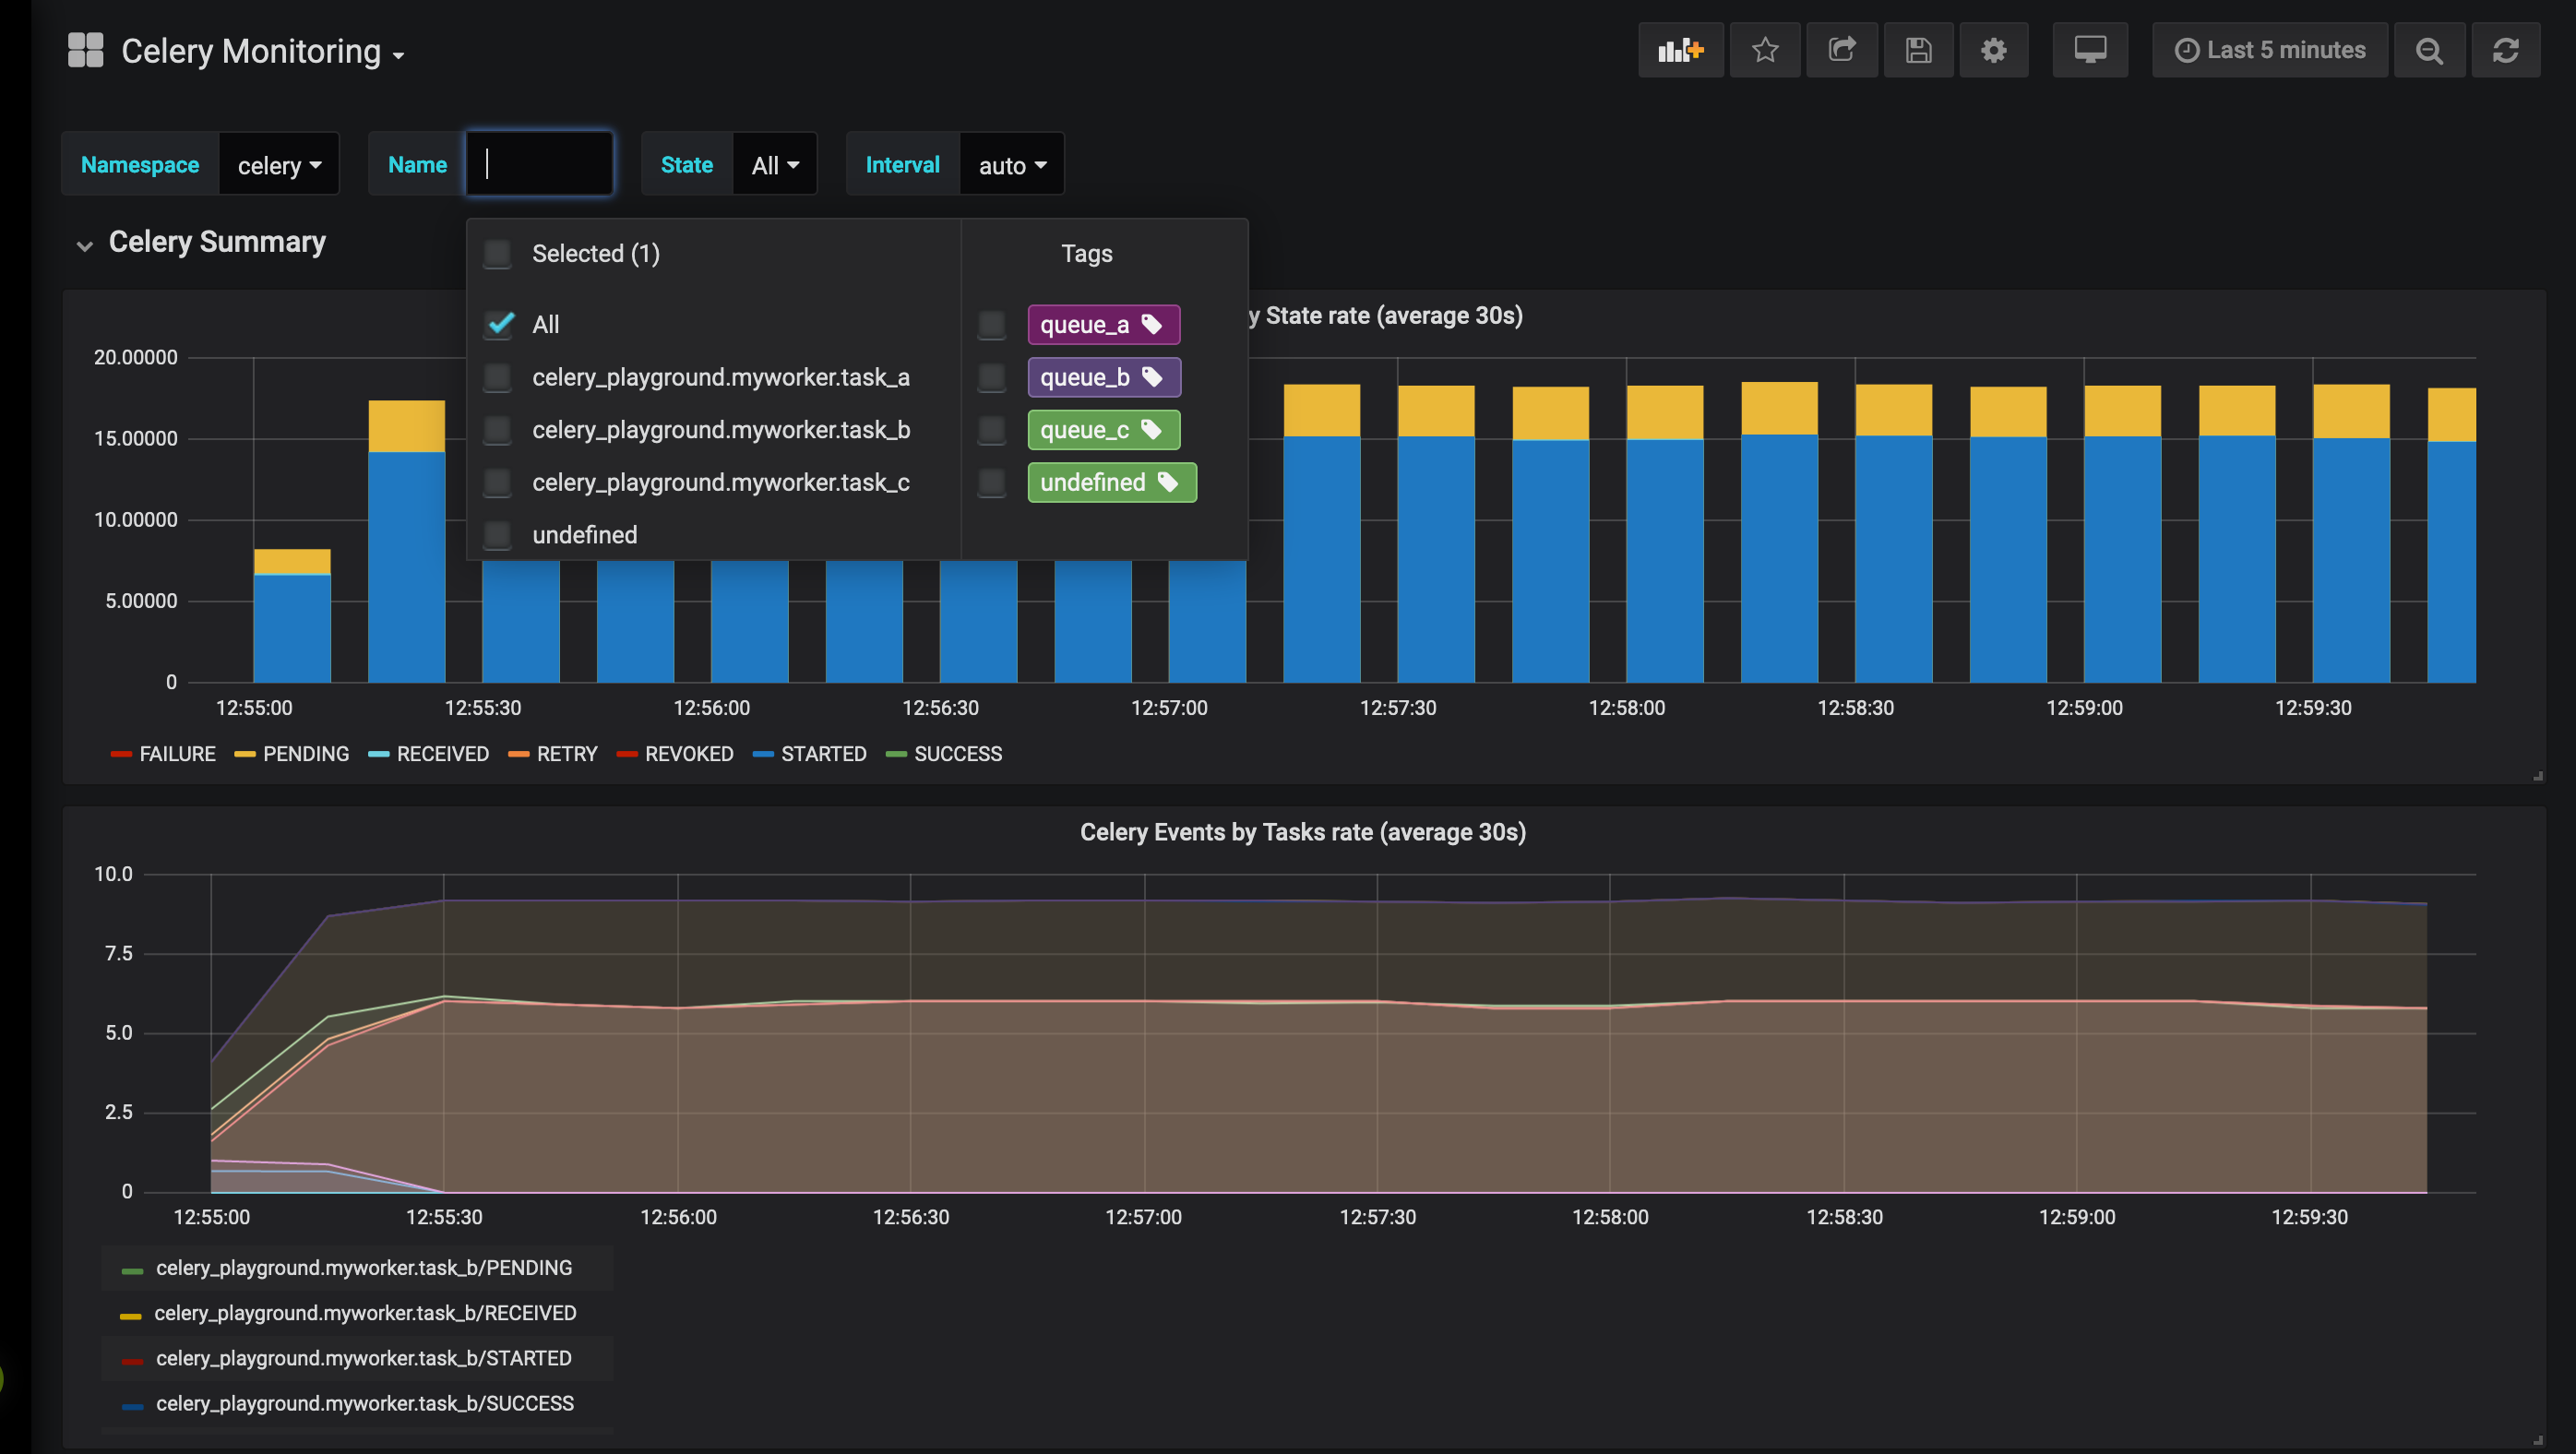
- Graph with events by state rate
- Graph with events by task rate
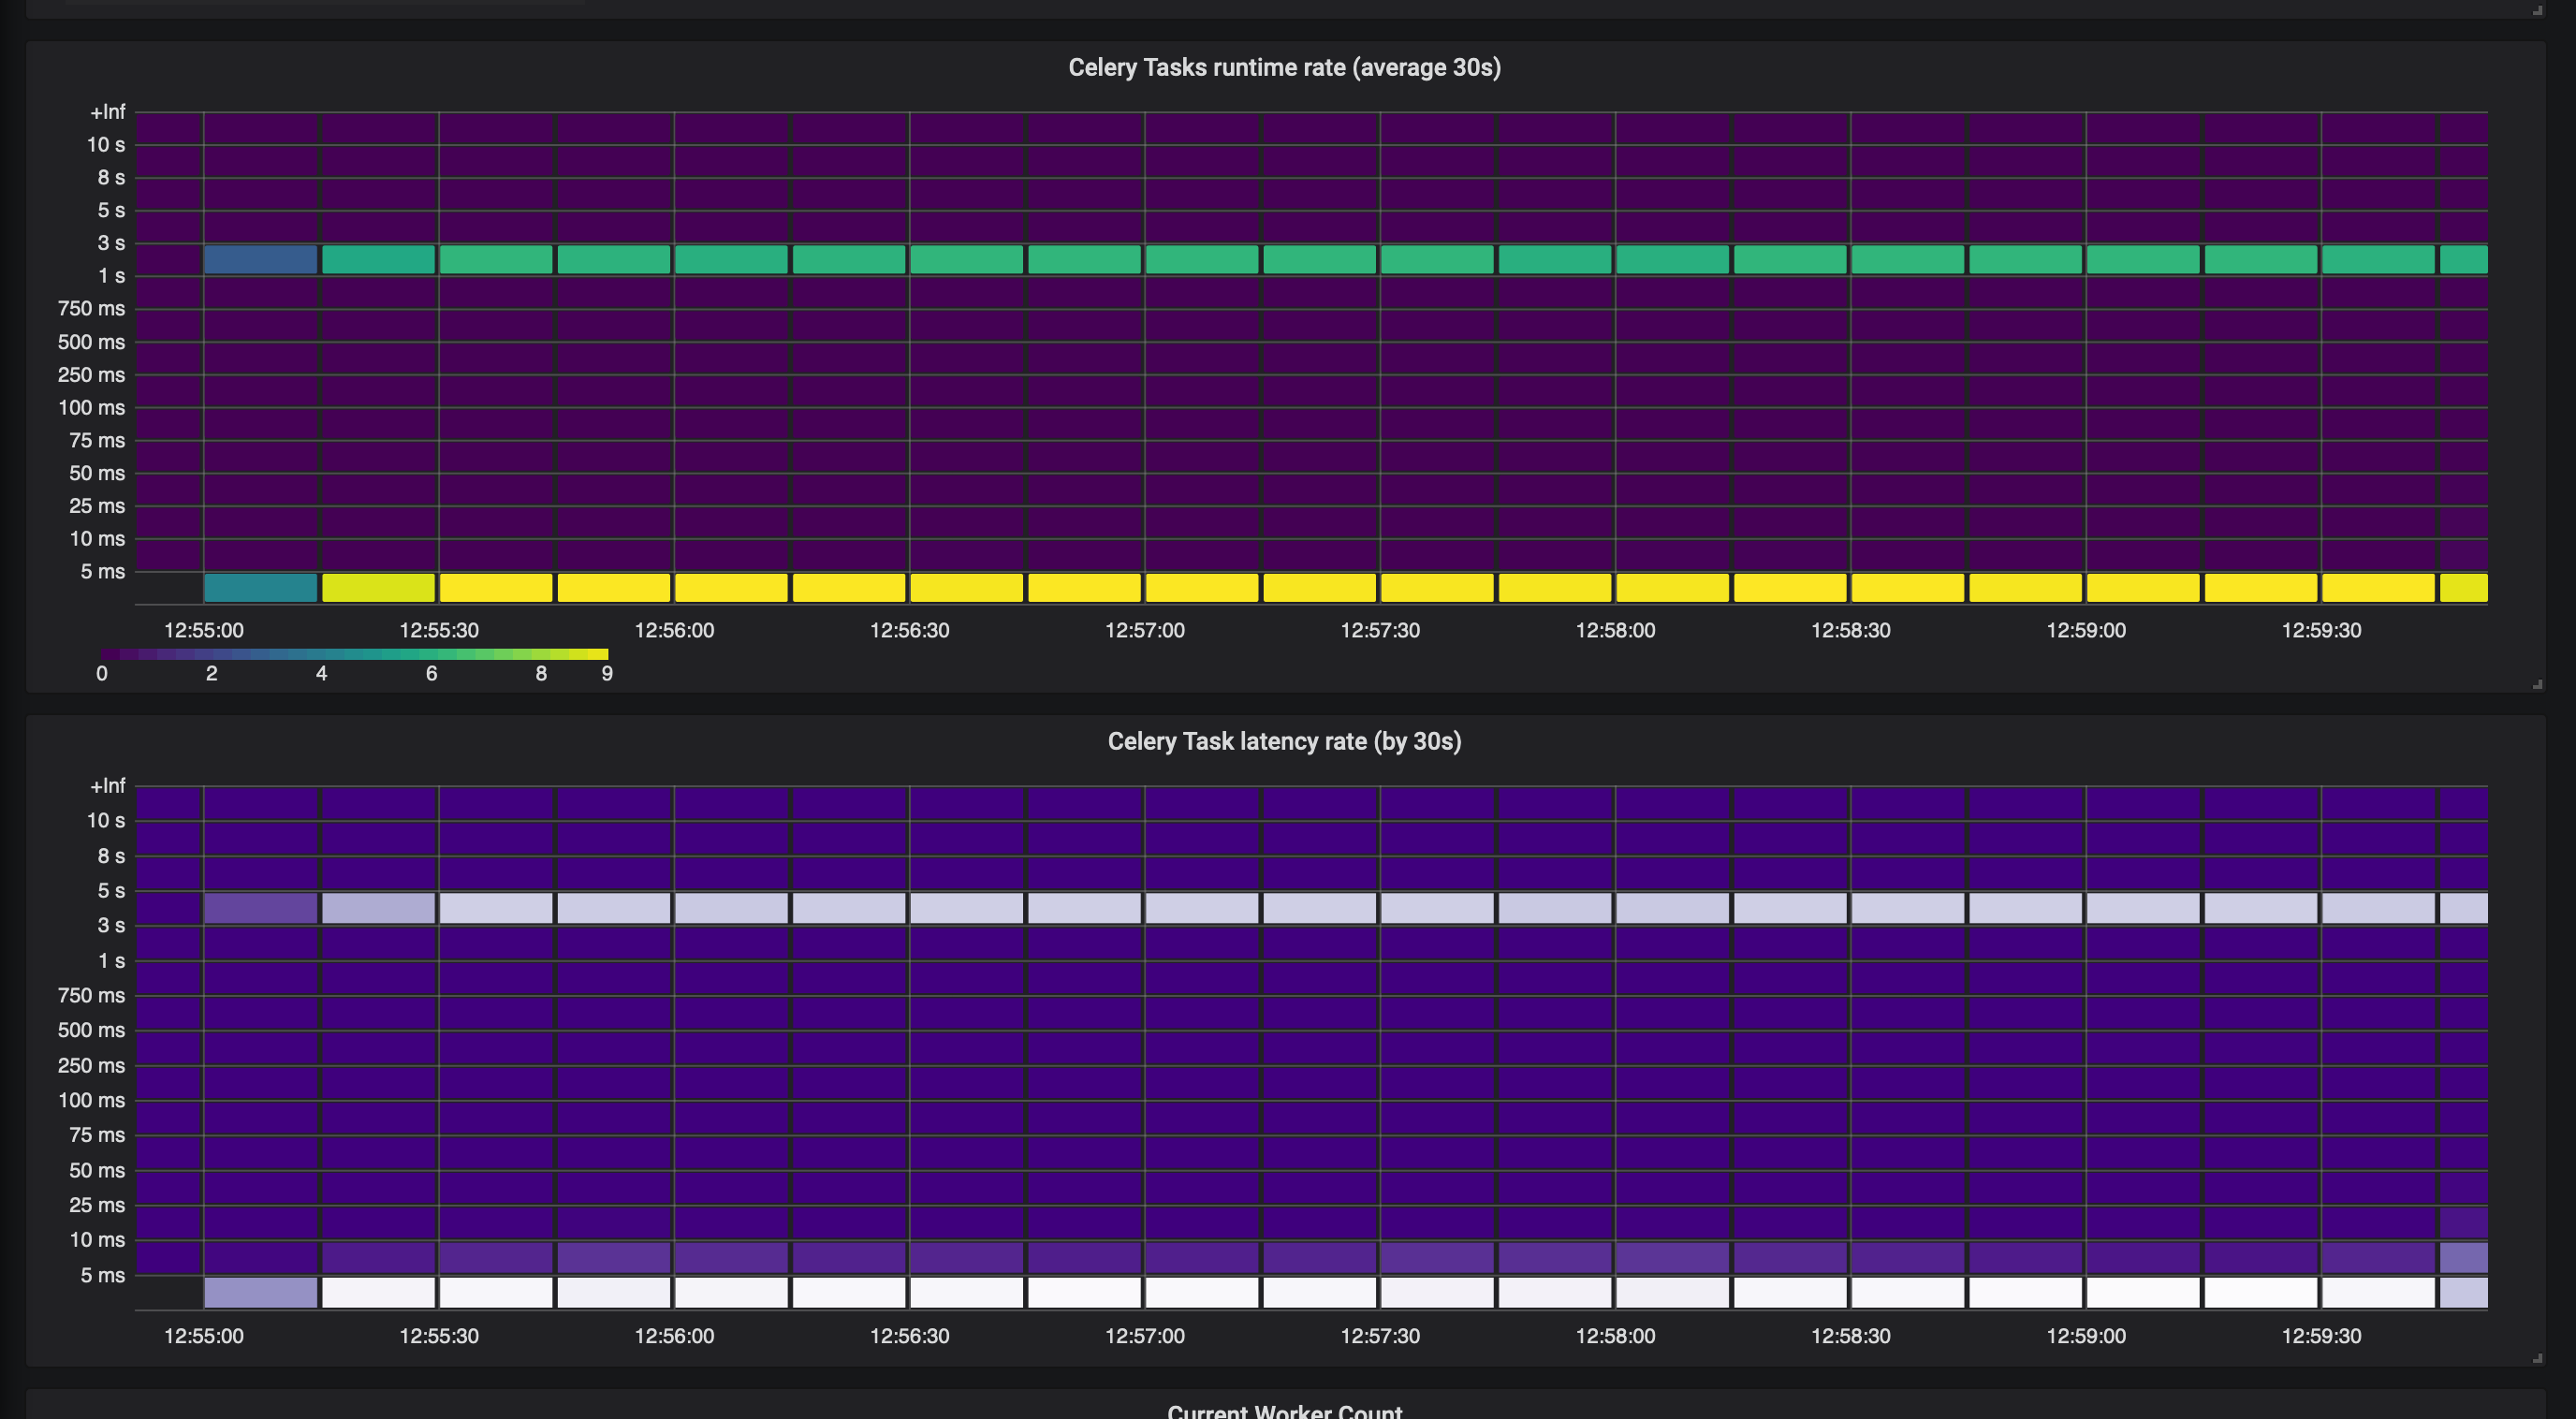
- Heatmap describing tasks runtime rate
- Heatmap describing general latency
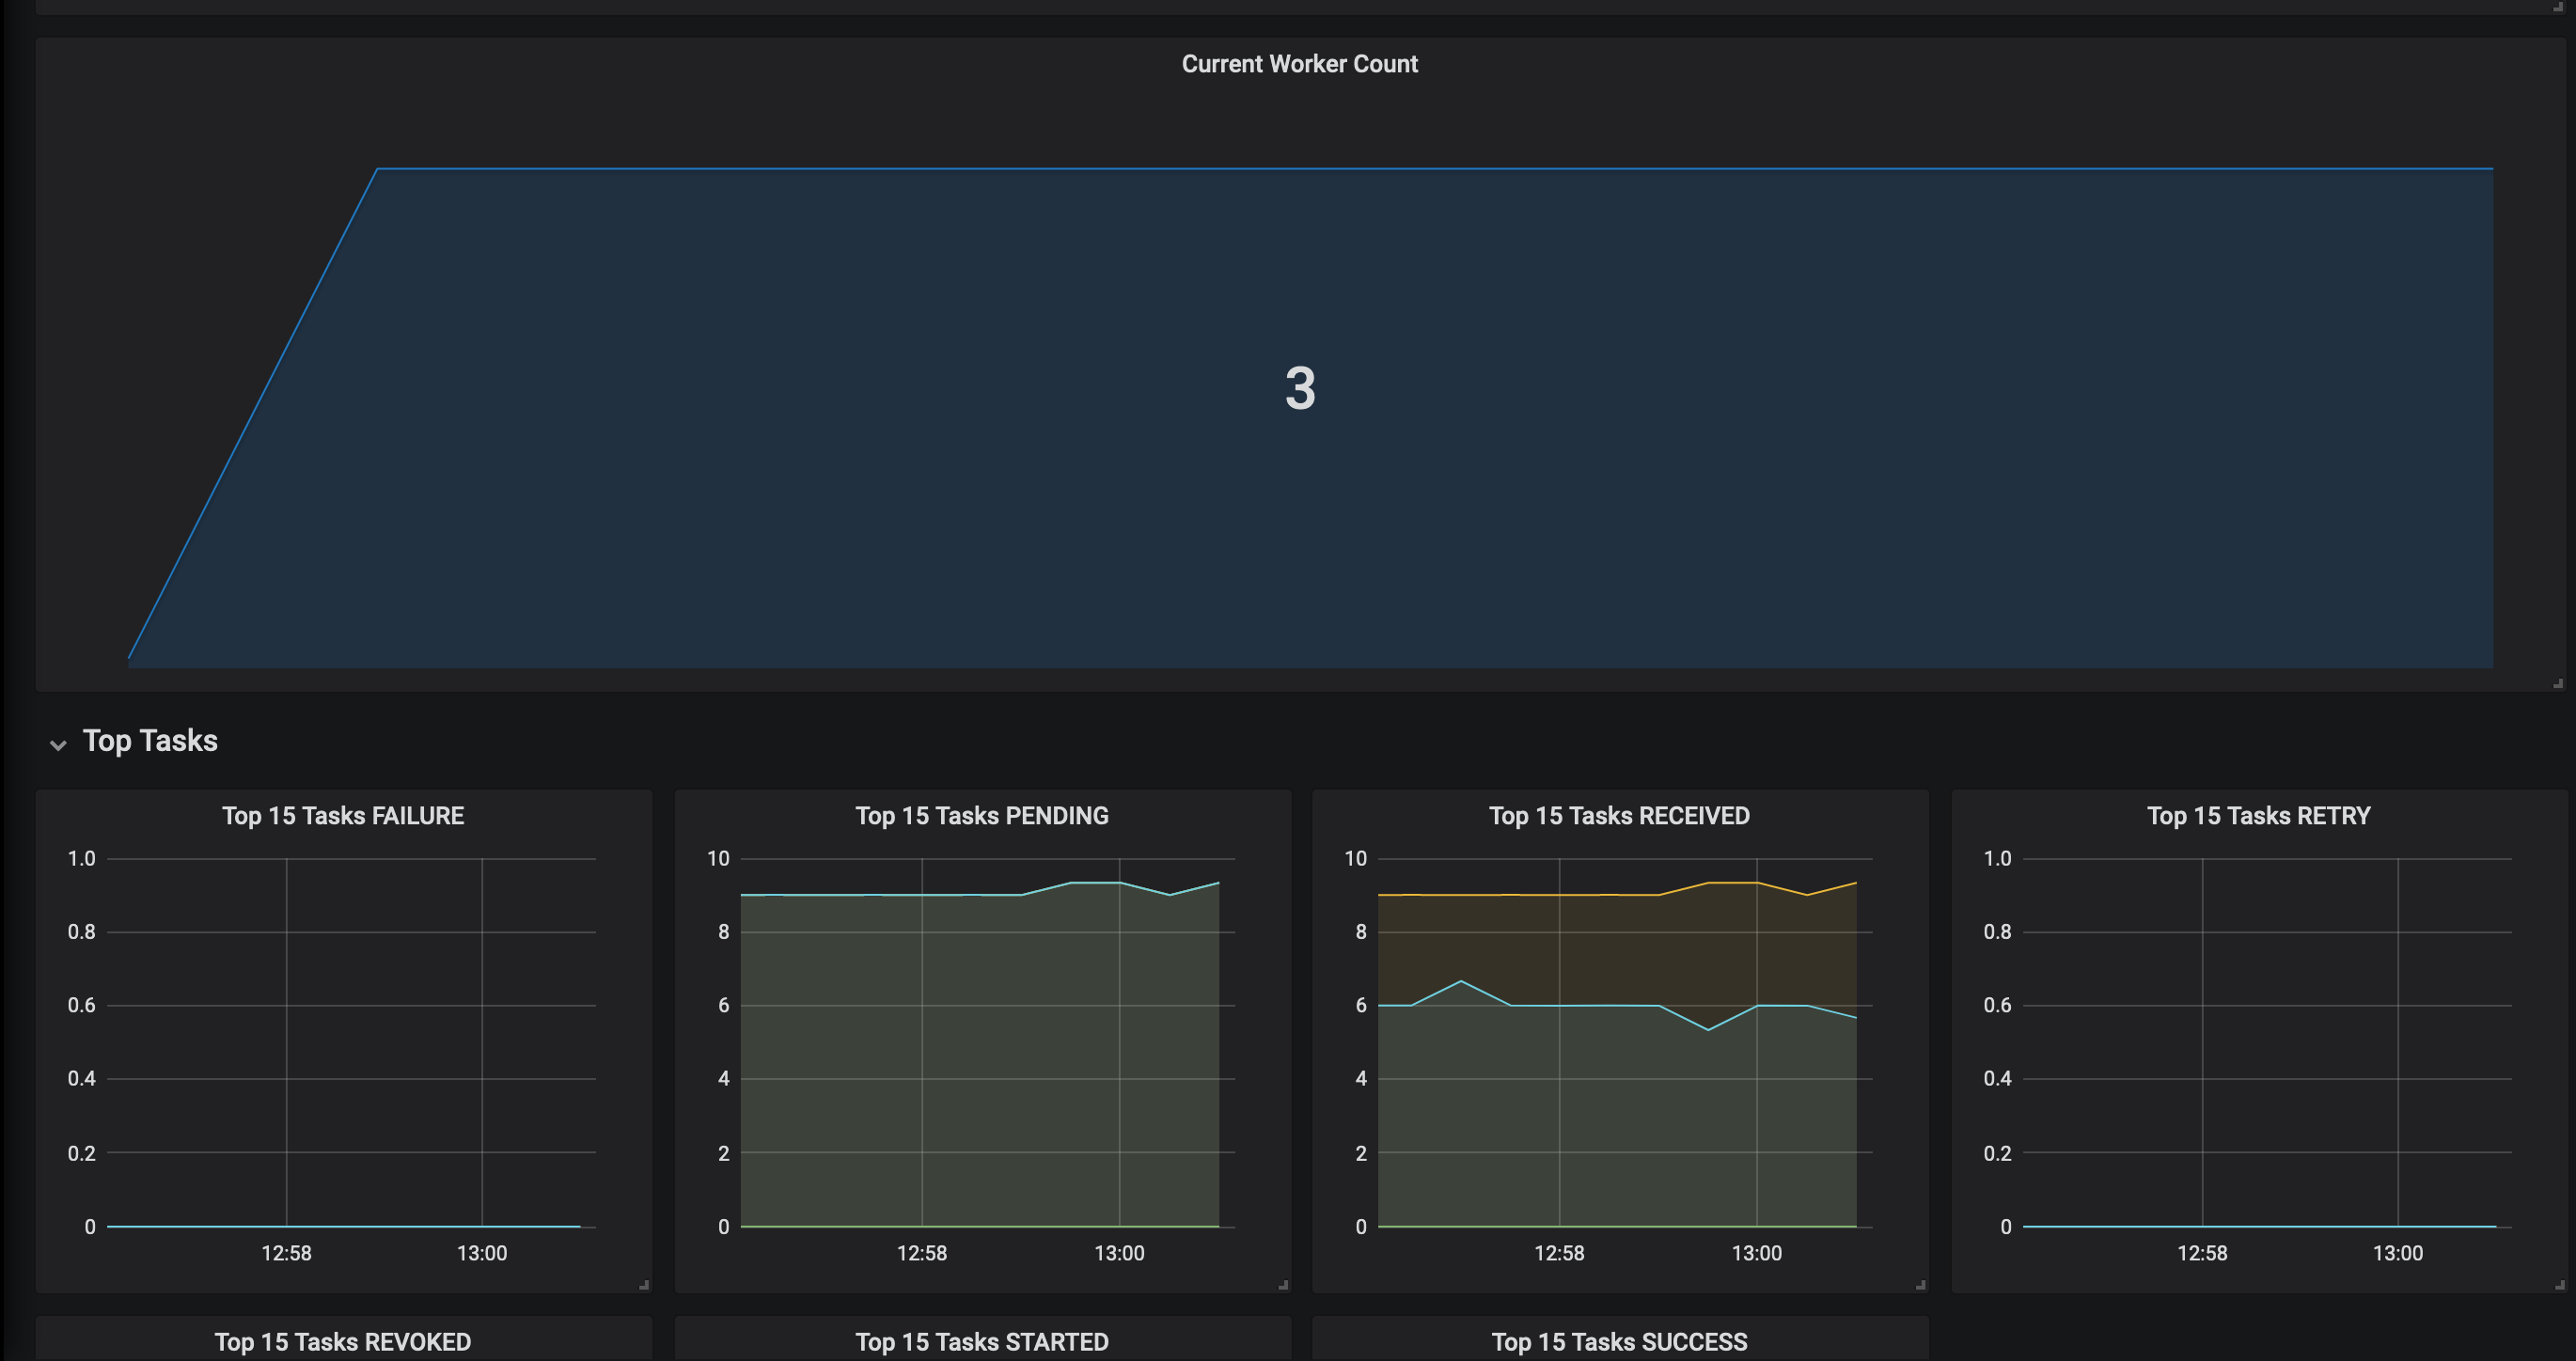
- Singlestat panel with count of alive workers
Used exporter: OvalMoney/celery-exporter
Data source config
Collector type:
Collector plugins:
Collector config:
Revisions
Upload an updated version of an exported dashboard.json file from Grafana
| Revision | Description | Created | |
|---|---|---|---|
| Download |