What you'll learn
- To use multiple data sources such as Prometheus, Grafana Loki, and Grafana Tempo.
- How you can weave these three together.
- To build a true single-pane-of-glass view into your system.
- How this can help reduce MTTI/MTTR
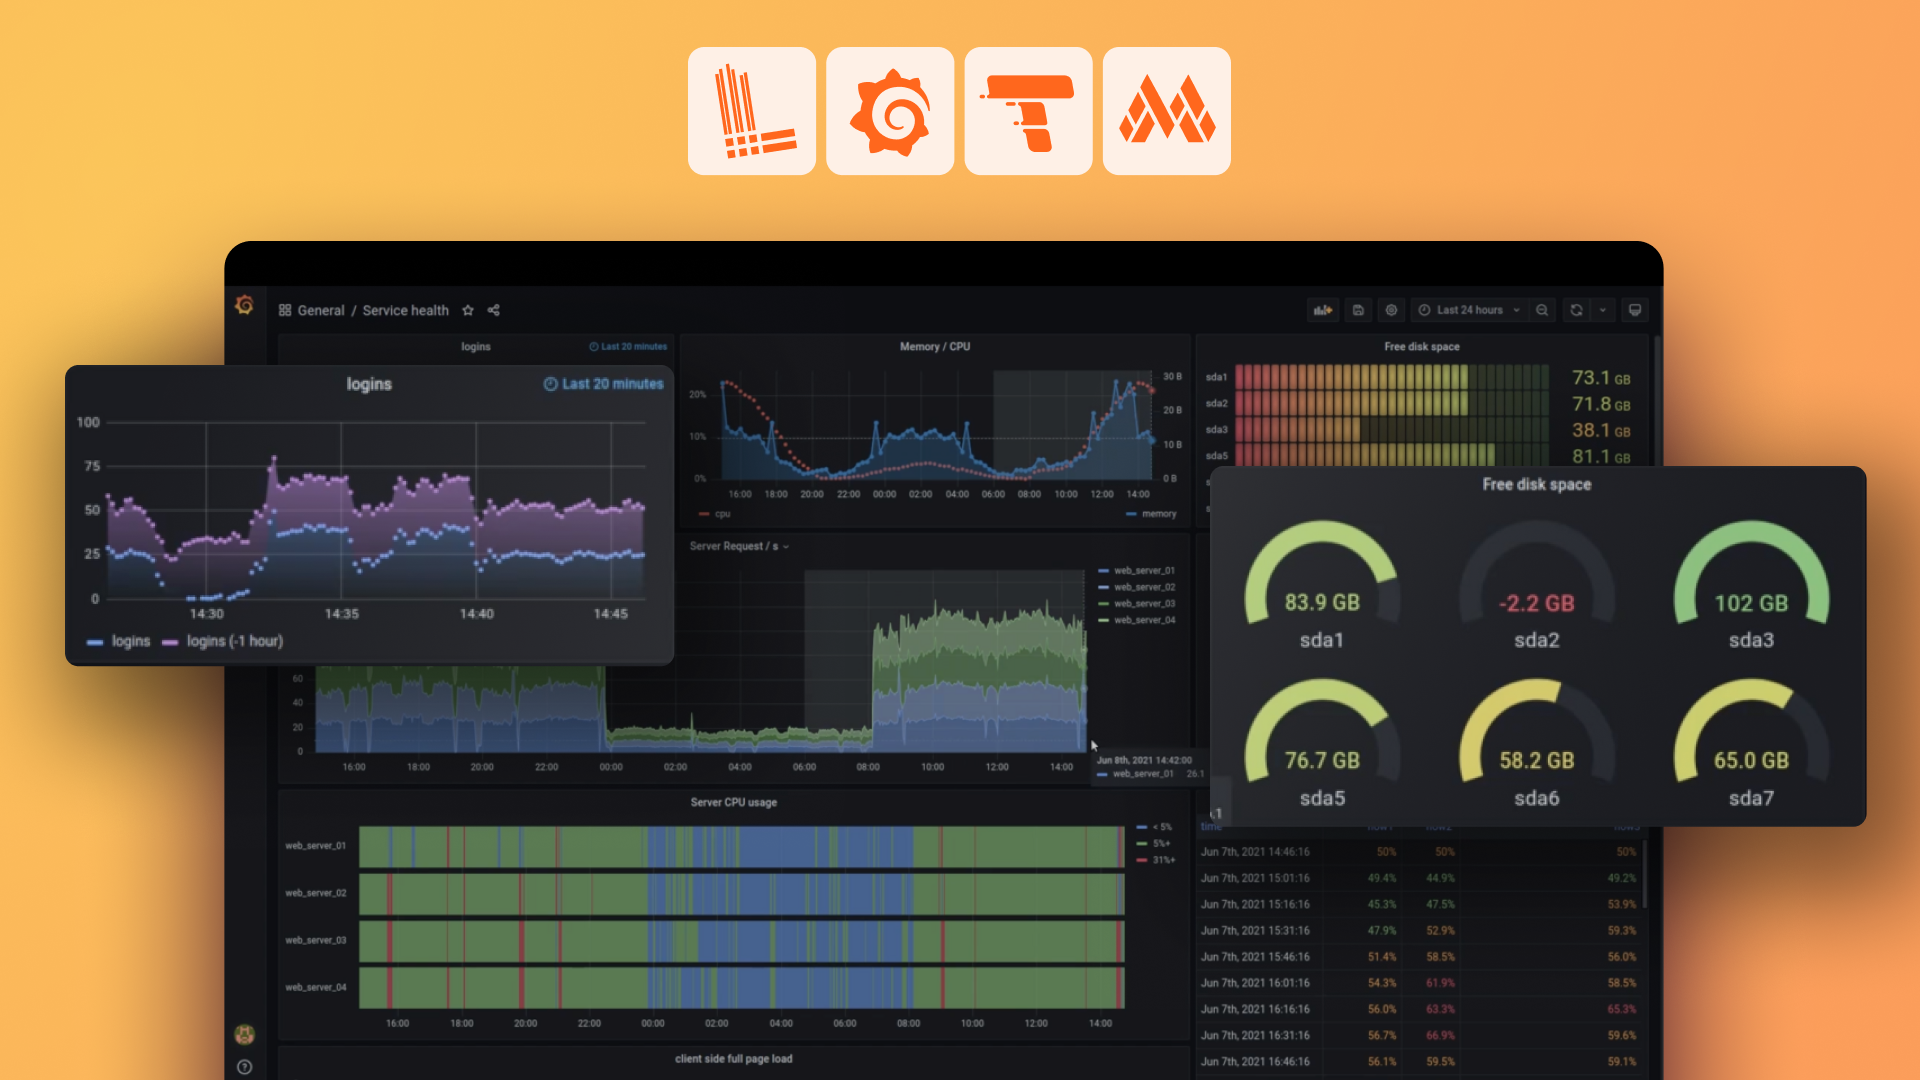
At Grafana Labs, we believe that users should have the freedom to use the tools they know and love. In this webinar, we’ll talk about taking metrics, logs, and traces from different data sources and visualizing all of it side-by-side in Grafana, where everyone in the organization can view it, interact with it, and correlate it. By using Grafana, you can reduce MTTR and focus your time and energy on the projects that have the most impact on your business: less time firefighting, more time innovating.
Additional resources to explore:
Your guide


