Company: Monta Industry: Energy & Utilities
Monta, an EV charging infrastructure company, provides a cloud platform that connects and manages over 220,000 electric vehicle charging devices across more than 400 hardware brands. The company supports millions of successful charging sessions each month and partners with major energy and mobility providers across Europe. Its platform delivers unified connectivity, smart charging capabilities, and reliable device management at global scale.
Challenge
Monta faced rapid growth in a fragmented EV charging ecosystem while operating with a legacy observability setup that depended on CloudWatch dashboards and single-instance Prometheus and Open Source Loki deployments. The company needed to unify its reliability posture, gain full visibility into device telemetry, and support compliance requirements while keeping costs predictable. Vendor lock-in risks and the need for scalable, self-managed data retention further drove the search for a modern observability approach.
Solution
Monta adopted a centralized observability strategy powered by Grafana Cloud products while evolving its self-hosted telemetry stack for scale.
- Implemented Grafana for visualization and organization-wide dashboarding to give engineering, support, and leadership shared visibility.
- Adopted Grafana Loki for distributed log aggregation and moved storage to S3 for scalable, redundant retention.
- Deployed Grafana Mimir to support tens of millions of active series and enable high-volume metric ingestion and long-term retention.
- Standardized on Grafana Cloud OnCall and Incident Management for alert routing, on-call scheduling, incident coordination, and organizational response workflows.
- Leveraged Grafana Cloud K6 synthetics to monitor frontend latency and availability across user flows.
Impact
Monta now operates a stable, scalable observability platform supporting near-real-time monitoring, streamlined incident response, and deep analytics on global device behavior. Teams across the company use Grafana Cloud daily to maintain reliability, reduce incident overhead, and make data-driven decisions.
- Achieved a highly cost-efficient observability footprint
- Enabled fast, consistent incident management with automated routing, 24/7 coverage, and cross-functional participation through a combination of Grafana Cloud and self developed tools
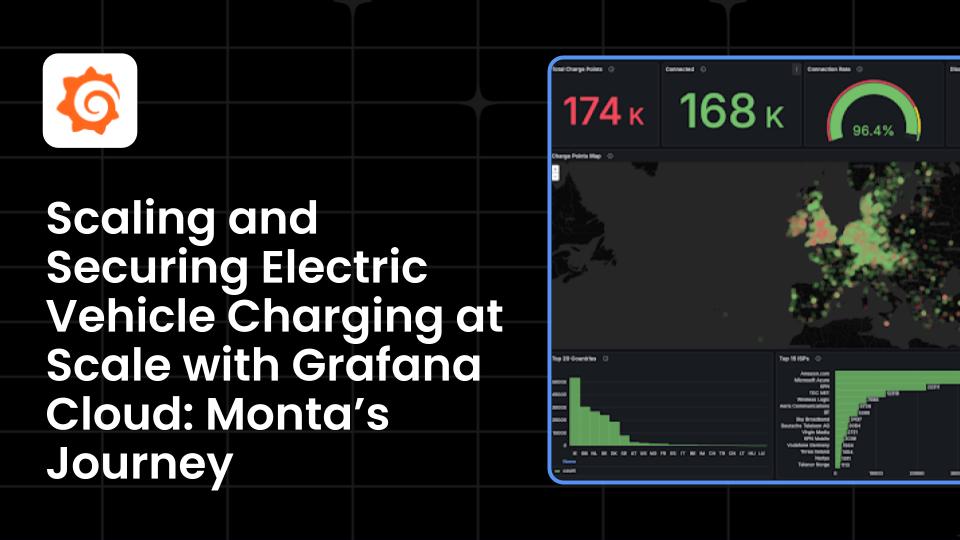
- Improved customer transparency with integrated status pages, ISP-level reliability insights, and geographic device visibility.
- Strengthened compliance with one-year log retention and traceability across financial and operational workflows.
- Increased engineering ownership through SLO tracking, automated Jira ticketing, and team-specific error-budget accountability.
Your guide


