Important: This documentation is about an older version. It's relevant only to the release noted, many of the features and functions have been updated or replaced. Please view the current version.
Quick start for Tempo
The Tempo repository provides multiple examples to help you quickly get started using Tempo and distributed tracing data.
Every example has a docker-compose.yaml manifest that includes all of the options needed to explore trace data in Grafana, including resource configuration and trace data generation.
The Tempo examples running with Docker using docker-compose include a version of Tempo and a storage configuration suitable for testing or development.
Before you begin
To follow this guide, you need:
- Git
- Docker
- The Docker Compose plugin (included with Docker Desktop)
Tip
Alternatively, you can try out this example in our interactive learning environment: Quick start for Tempo.
It’s a fully configured environment with all the dependencies installed.
Provide feedback, report bugs, and raise issues in the Grafana Killercoda repository.
Clone the Tempo repository and start Docker
This quick start guide uses the local example running Tempo as a single binary (monolithic). Any data is stored locally in the tempo-data folder.
To learn more, read the local storage example README.
Clone the Tempo repository:
git clone https://github.com/grafana/tempo.gitGo into the examples directory:
cd tempo/example/docker-compose/localStart the services defined in the docker-compose file:
docker compose up -dVerify that the services are running:
docker compose psYou should see something like:
docker compose ps
NAME                 COMMAND                  SERVICE             STATUS              PORTS
local-grafana-1      "/run.sh"                grafana             running             0.0.0.0:3000->3000/tcp
local-k6-tracing-1   "/k6-tracing run /ex…"   k6-tracing          running
local-prometheus-1   "/bin/prometheus --c…"   prometheus          running             0.0.0.0:9090->9090/tcp
local-tempo-1        "/tempo -config.file…"   tempo               running             0.0.0.0:3200->3200/tcp, 0.0.0.0:4317-4318->4317-4318/tcp, 0.0.0.0:9411->9411/tcp, 0.0.0.0:14268->14268/tcp
Explore the traces in Grafana
As part of the Docker Compose manifest, Grafana is now accessible on port 3000. You can use Grafana to explore the traces generated by the k6-tracing service.
Open a browser and navigate to http://localhost:3000.
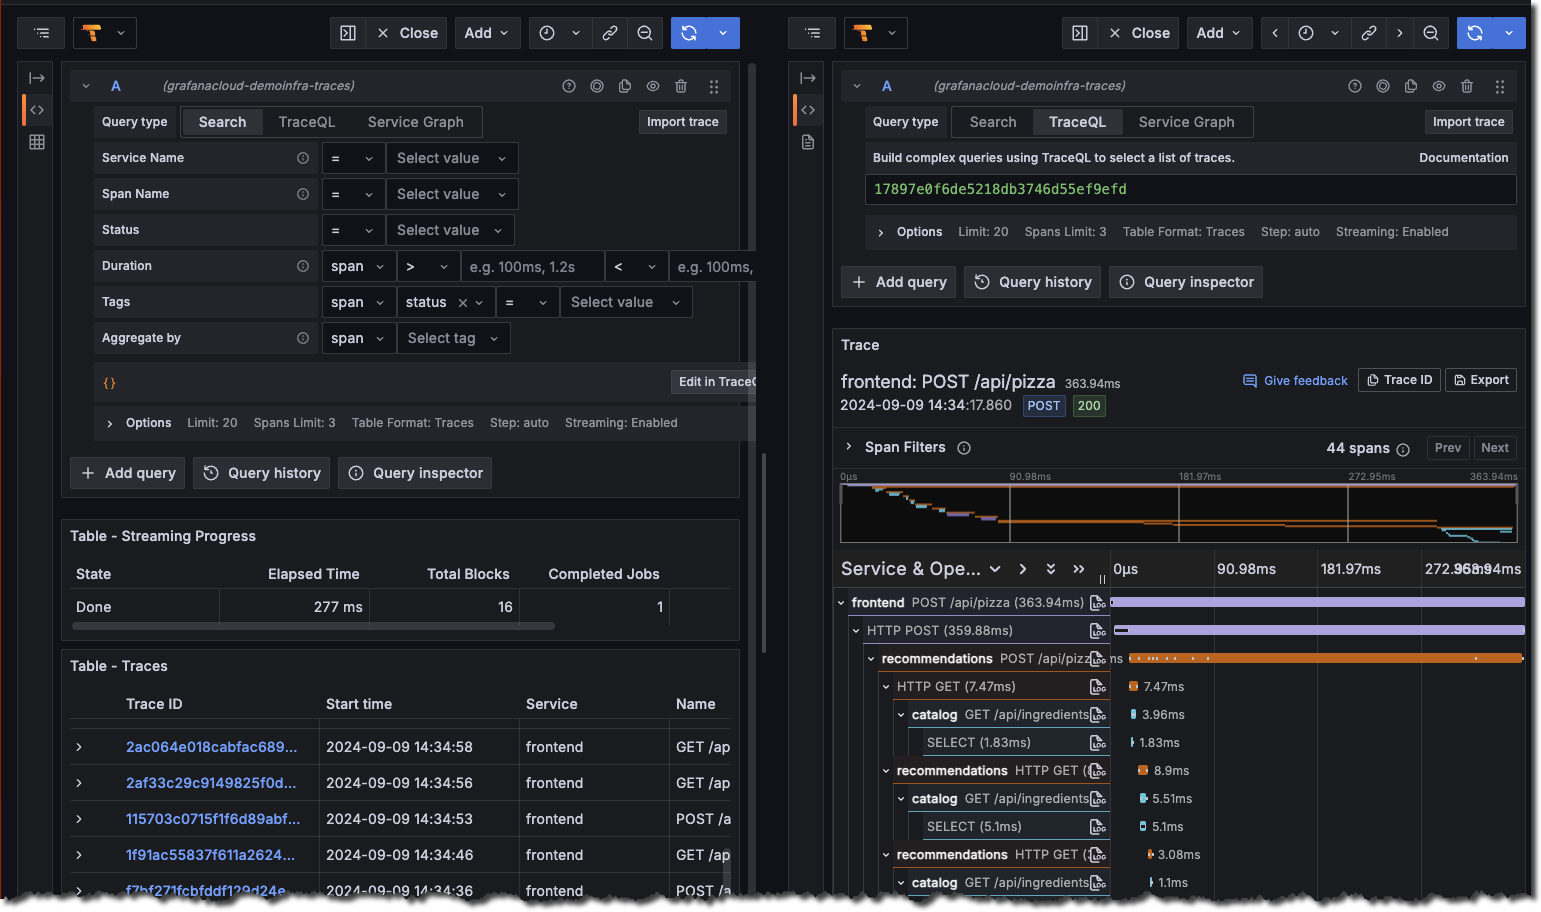
Once logged in, navigate to the Explore page, select the Tempo data source and select the Search tab. Select Run query to list the recent traces stored in Tempo. Select one to view the trace diagram:
![Use the query builder to explore tracing data in Grafana]()
A couple of minutes after Tempo starts, select the Service graph tab for the Tempo data source in the Explore page. Select Run query to view a service graph, generated by Tempo’s metrics-generator.
![Service graph sample]()
To stop the services:
docker compose down -v

Next steps
You have successfully set up Tempo and Grafana to explore traces generated by the k6-tracing service.
Alternative: Complete MLTP example
If you would like to use a demo with multiple telemetry signals, then try the Introduction to Metrics, Logs, Traces, and Profiling in Grafana.
Intro-to-mltp provides a self-contained environment for learning about Mimir, Loki, Tempo, Pyroscope, and Grafana.
The project includes detailed explanations of each component and annotated configurations for a single-instance deployment.
Data from intro-to-mltp can also be pushed to Grafana Cloud.
Further reading
Here are some resources to help you learn more about Tempo:

