This is documentation for the next version of Grafana Tempo documentation. For the latest stable release, go to the latest version.
Service graphs
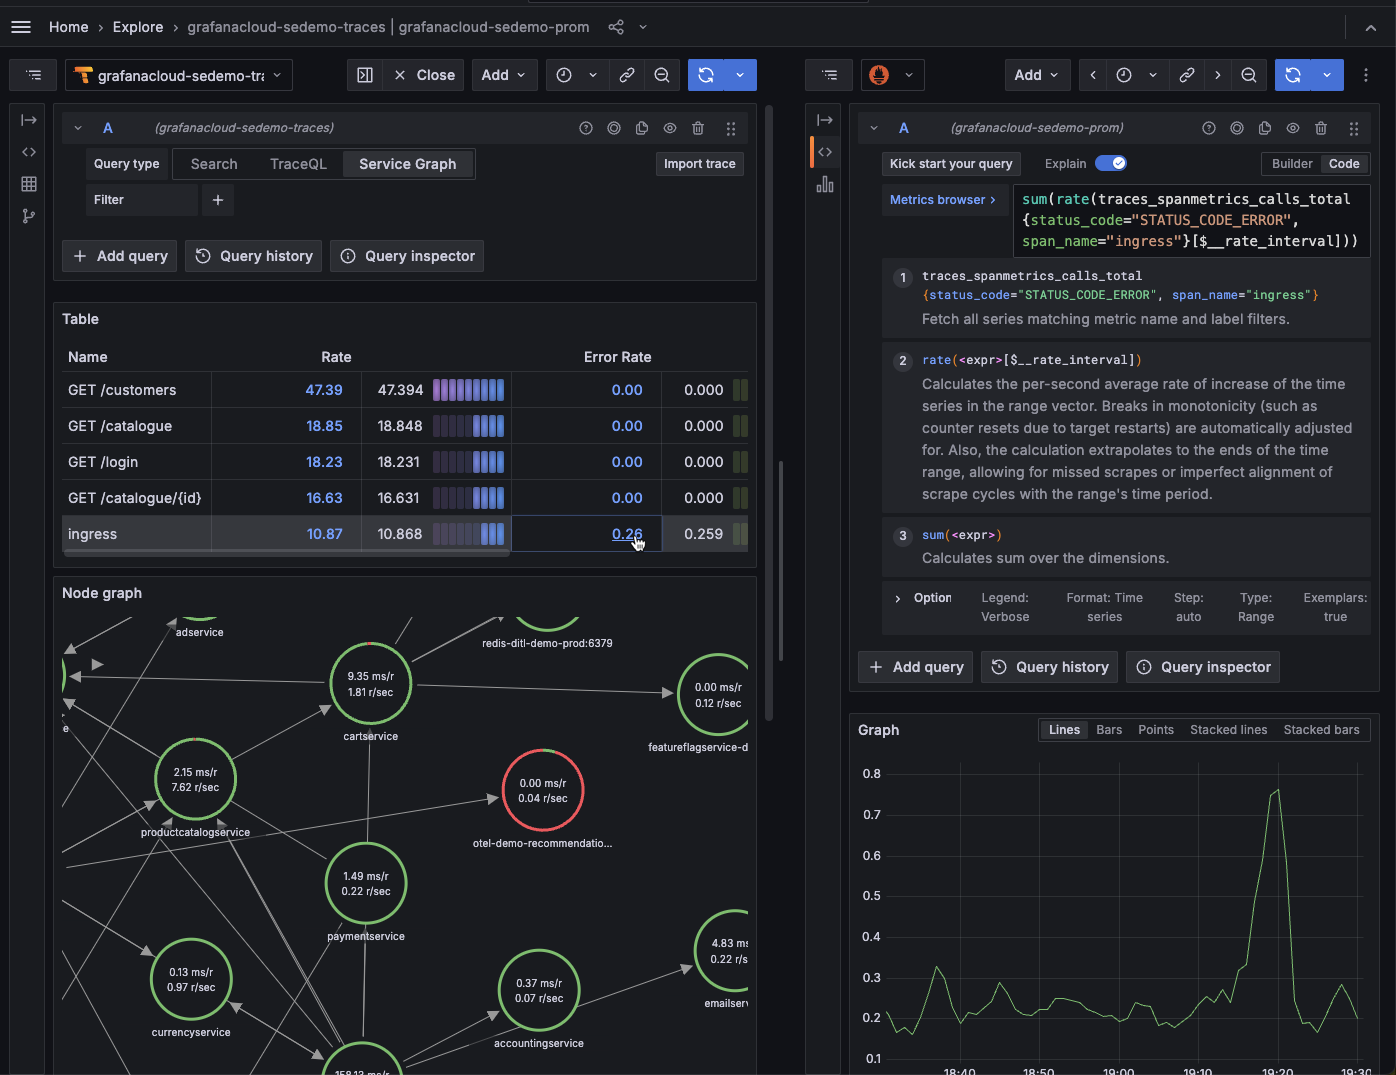
A service graph is a visual representation of the interrelationships between various services. Service graphs help you to understand the structure of a distributed system, and the connections and dependencies between its components:
- Infer the topology of a distributed system. As distributed systems grow, they become more complex. Service graphs help you to understand the structure of the system.
- Provide a high-level overview of the health of your system. Service graphs display error rates, latencies, as well as other relevant data.
- Provide an historic view of a system’s topology. Distributed systems change very frequently, and service graphs offer a way of seeing how these systems have evolved over time.
Service graphs can be generated from metrics created by the metrics-generator or Grafana Alloy. Refer to Enable service graphs for more information on how to enable service graphs in Tempo.
How they work
The metrics-generator and Grafana Alloy both process traces and generate service graphs in the form of Prometheus metrics.
Service graphs work by inspecting traces and looking for spans with parent-children relationship that represent a request. The processor uses the OpenTelemetry semantic conventions to detect a myriad of requests.
It supports the following requests:
- A direct request between two services where the outgoing and the incoming span must have
span.kind,client, andserver, respectively. - A request across a messaging system where the outgoing and the incoming span must have
span.kind,producer, andconsumerrespectively. - A database request; in this case the processor looks for spans containing attributes
span.kind=clientas well as one ofdb.namespace,db.nameordb.system. You can customize which attributes identify a database span using thedatabase_name_attributesconfiguration option. See below for how the name of the node is determined for a database request.
The processor keeps every span that can form a request pair in an in-memory store until the corresponding pair span arrives or the maximum waiting time passes. When either condition occurs, the processor records the request and removes it from the local store.
Each emitted metrics series have the client and server label corresponding with the service doing the request and the service receiving the request.
traces_service_graph_request_total{client="app", server="db", connection_type="database"} 20Virtual nodes
Virtual nodes are nodes that form part of the lifecycle of a trace, but spans for them aren’t collected because they’re outside the user’s reach or aren’t instrumented. For example, you might not collect spans for an external service for payment processing that’s outside user interaction.
The processor detects virtual nodes in two ways:
- Uninstrumented client (missing client span): The root span has
span.kindset toserverorconsumer, with no matching client span. This indicates that the request or message was initiated by an external system that isn’t instrumented, like a scheduler, a frontend application, or an engineer usingcurl.- In the Tempo metrics-generator, the processor checks the configured
peer_attributeson the server span first. If it finds a matching attribute, it uses that value as the client node name. Otherwise, the client node name defaults touser. - In Grafana Alloy and the OpenTelemetry Collector
servicegraphconnector, the connector doesn’t evaluate peer attributes for this case. The client node name always defaults touserand you can’t override it. An upstream feature request exists to add this capability.
- In the Tempo metrics-generator, the processor checks the configured
- Uninstrumented server (missing server span): A
clientspan doesn’t have its matchingserverspan, but has a peer attribute present. In this case, the client called an external service that doesn’t send spans. The processor uses the peer attribute value as the virtual server node name.- The default peer attributes are
peer.service,db.name, anddb.system. - The processor searches the attributes in order and uses the first match as the virtual node name.
- The default peer attributes are
The processor identifies a database node when the span has at least one db.namespace, db.name, or db.system attribute.
The processor determines the database node name using the following span attributes in order of precedence: peer.service, server.address, network.peer.address:network.peer.port, db.namespace, db.name.
Metrics
The following metrics are exported:
The processor measures duration from both the client and server sides.
Possible values for connection_type: unset, virtual_node, messaging_system, or database.
You can include additional labels using the dimensions configuration option or the enable_virtual_node_label option.
Since the service graph processor has to process both sides of an edge, it needs to process all spans of a trace to function properly. If spans of a trace spread across multiple instances, the processor can’t pair them reliably.
Activate enable_virtual_node_label
Activating this feature adds the following label and corresponding values:
Configuration options
The service graphs processor has several configuration options beyond dimensions and enable_virtual_node_label.
For the full YAML schema and defaults, refer to the
configuration reference.
Span multiplier
When traces are sampled, the raw request counts produced by the service graph processor underrepresent actual traffic.
The span_multiplier_key option specifies a span or resource attribute that contains the sampling ratio.
The processor computes the inverse of this value to scale the metrics accordingly.
For example, if a span has attribute X-SampleRatio=0.1 (10% sampling), setting span_multiplier_key: "X-SampleRatio" causes each sampled span to count as 10 requests.
The enable_tracestate_span_multiplier option provides an alternative approach that extracts the multiplier from the W3C tracestate header using the OpenTelemetry probability sampling threshold (ot=th:<hex>).
When enabled, the tracestate threshold takes priority over span_multiplier_key.
Database name attributes
The database_name_attributes option controls which span attributes the processor uses to identify a span as a database request.
The defaults are db.namespace, db.name, and db.system.
You can override this list to match your instrumentation if it uses non-standard attribute names.
Filter policies
The filter_policies option lets you include or exclude spans from service graph generation based on span attributes.
This works the same way as filter policies for
span metrics.

