Use Profiles Drilldown to investigate issues
Note
Profiles Drilldown is currently in public preview. Grafana Labs offers limited support, and breaking changes might occur prior to the feature being made generally available.
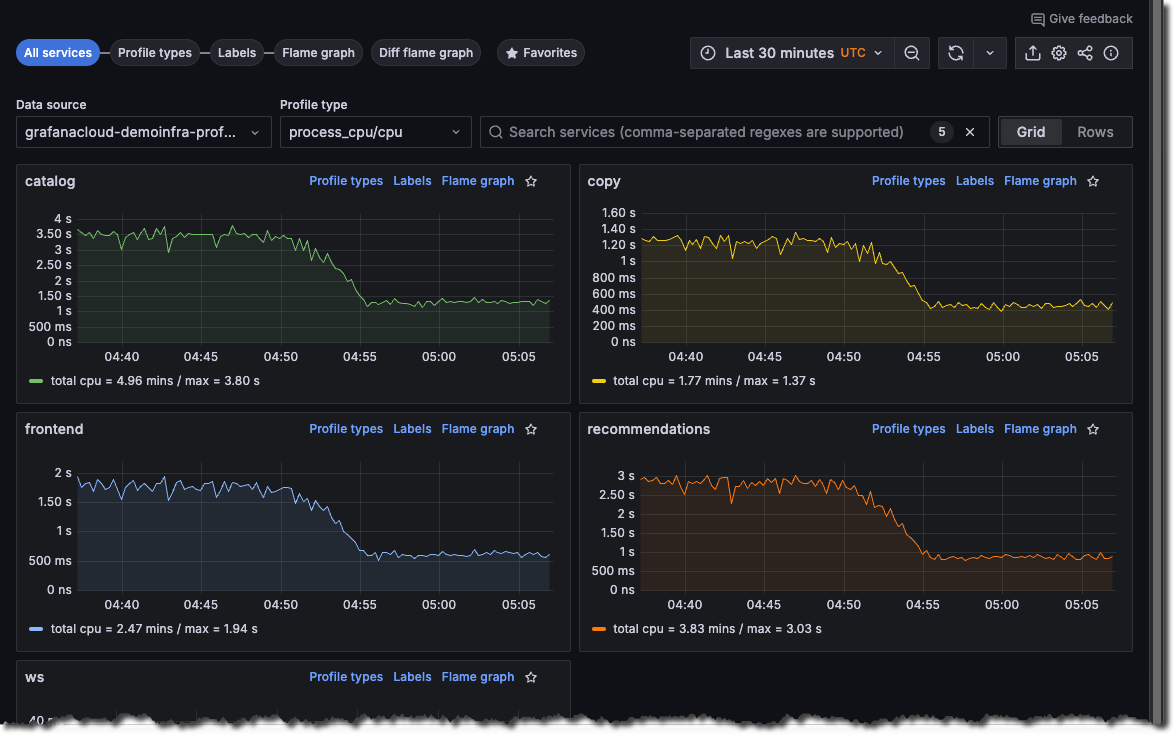
Grafana Profiles Drilldown is designed to make it easy to visualize and analyze profiling data. There are several different modes for viewing, analyzing, and comparing profiling data.
The main use cases are the following:
- Proactive: Cutting costs, addressing latency issues, or optimizing memory usage for applications
- Reactive: Resolving incidents with line-level accuracy or debugging active latency/memory issues
Profiles Drilldown provides an intuitive interface to specifically support these use cases. You get a holistic view of all of your services and how they’re functioning, but also the ability to drill down for more targeted root cause analysis.

Profiles Drilldown offers a convenient platform to analyze profiles and get insights that are impossible to get from using other traditional signals like logs, metrics, or tracing.
With Grafana Play, you can explore and see how it works, learning from practical examples to accelerate your development. This feature can be seen on the Grafana Play site.
Continuous profiling
While code profiling has been a long-standing practice, continuous profiling represents a modern and more advanced approach to performance monitoring.
This technique adds two critical dimensions to traditional profiles:
- Time
- Profiling data is collected continuously, providing a time-centric view that allows querying performance data from any point in the past.
- Metadata
- Metadata enriches profiling data, adding contextual depth to the performance data.
These dimensions, coupled with the detailed nature of performance profiles, make continuous profiling a uniquely valuable tool.
Flame graphs
Flame graphs help you visualize resource allocation and performance bottlenecks, and you even get suggested recommendations and performance fixes via AI-driven flame graph analysis, as well as line-level insights from our GitHub integration.
On views with a flame graph, you can use Explain flame graph to provide an AI flame graph analysis that explains the performance bottleneck, root cause, and recommended fix. For more information, refer to Flame graph AI.


