Ruby
The Ruby Profiler revolutionizes performance tuning in Ruby applications. Integrated with Pyroscope, it offers real-time performance data, allowing developers to delve deep into their Ruby codebase. This tool is essential for identifying performance issues, optimizing code efficiency, and enhancing the overall speed and reliability of Ruby applications.
Note
Refer to Available profiling types for a list of profile types supported by Ruby.
Before you begin
To capture and analyze profiling data, you need either a hosted Pyroscope OSS server or a hosted Pyroscope instance with Grafana Cloud Profiles (requires a free Grafana Cloud account).
The Pyroscope server can be a local server for development or a remote server for production use.
Add Ruby profiling to your application
Add the pyroscope gem to your Gemfile:
bundle add pyroscopeConfigure the Ruby client
Add the following code to your application. If you’re using Rails, put this into config/initializers directory. This code will initialize the Pyroscope profiler and start profiling:
require 'pyroscope'

Pyroscope.configure do |config|
  config.application_name = "my.ruby.app" # replace this with some name for your application
  config.server_address   = "http://my-pyroscope-server:4040" # replace this with the address of your Pyroscope server
end
How to add profiling labels to Ruby applications
The Pyroscope Ruby integration provides a number of ways to tag profiling data. For example, you can provide tags when you’re initializing the profiler:
require 'pyroscope'

Pyroscope.configure do |config|
  config.application_name = "my.ruby.app"
  config.server_address   = "http://my-pyroscope-server:4040"

  config.tags = {
    "hostname" => ENV["HOSTNAME"],
  }
end
Or you can dynamically tag certain parts of your code:
Pyroscope.tag_wrapper({ "controller": "slow_controller_i_want_to_profile" }) do
  slow_code
end
Rails profiling auto-instrumentation
By default, if you add Pyroscope to a Rails application it will automatically tag your actions with a action="<controller_name>/<action_name>" tag.
To disable Rails auto-instrumentation, set autoinstrument_rails to false:
Pyroscope.configure do |config|
  config.autoinstrument_rails = false
  # more configuration
end
Sending data to Pyroscope OSS or Grafana Cloud Profiles with Ruby SDK
require "pyroscope"

Pyroscope.configure do |config|
  config.application_name = "example.ruby.app"
  config.server_address = "<URL>"
  config.basic_auth_username='<User>'
  config.basic_auth_password='<Password>'
  # Optional Pyroscope tenant ID (only needed if using multi-tenancy). Not needed for Grafana Cloud.
  # config.tenant_id='<TenantID>'
end
To configure the Ruby SDK to send data to Pyroscope, replace the <URL> placeholder with the appropriate server URL. This could be the Grafana Cloud URL or your own custom Pyroscope server URL.
If you need to send data to Grafana Cloud, you’ll have to configure HTTP Basic authentication. Replace <User> with your Grafana Cloud stack user and <Password> with your Grafana Cloud API key.
If your Pyroscope server has multi-tenancy enabled, you’ll need to configure a tenant ID. Replace <TenantID> with your Pyroscope tenant ID.
Locate the URL, user, and password in Grafana Cloud Profiles
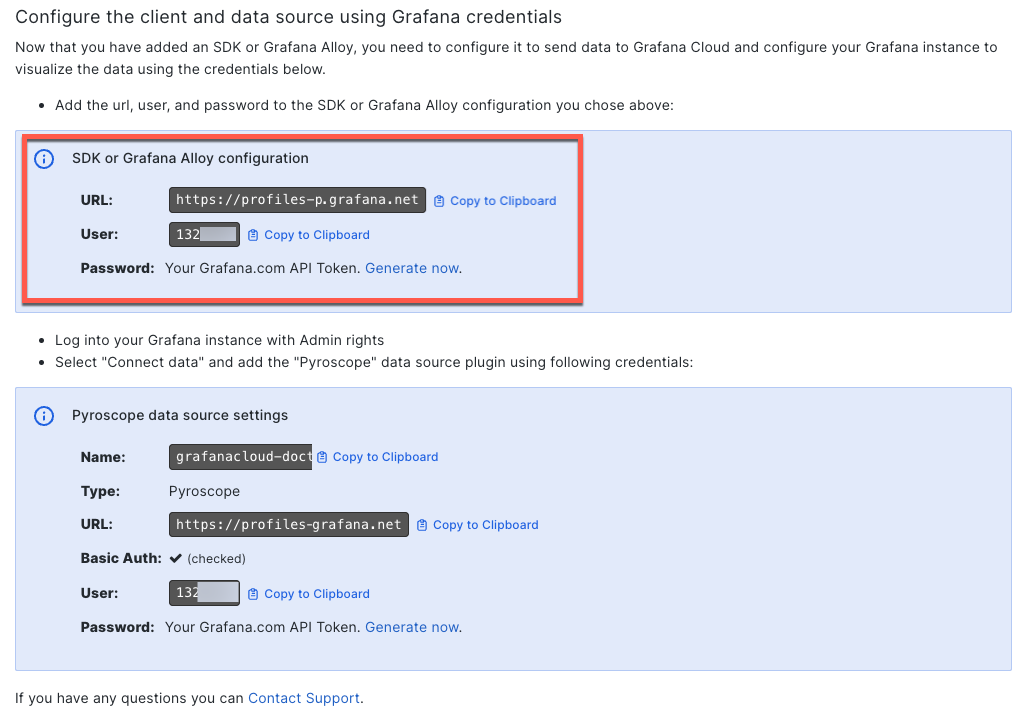
When you configure Alloy or your SDK, you need to provide the URL, user, and password for your Grafana Cloud stack. This information is located in the Pyroscope section of your Grafana Cloud stack.
- Navigate to your Grafana Cloud stack.
- Select Details next to your stack.
- Locate the Pyroscope section and select Details.
- Copy the URL, User, and Password values in the Configure the client and data source using Grafana credentials section.
![Locate the SDK or Grafana Alloy configuration values]()
- Use these values to complete the configuration.
As an alternative, you can also create a Cloud Access Policy and generate a token to use instead of the user and password. For more information, refer to Create a Cloud Access Policy.
Ruby profiling examples
Check out the following resources to learn more about Ruby profiling:
- Ruby examples demonstrating how Ruby applications, including Rails, can be profiled with Pyroscope.
- A Ruby demo on play.grafana.org.


