Table
The Table mode provides many variations, from a simple single variable view to an advanced TreeView.
Single variable
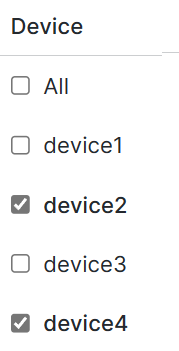
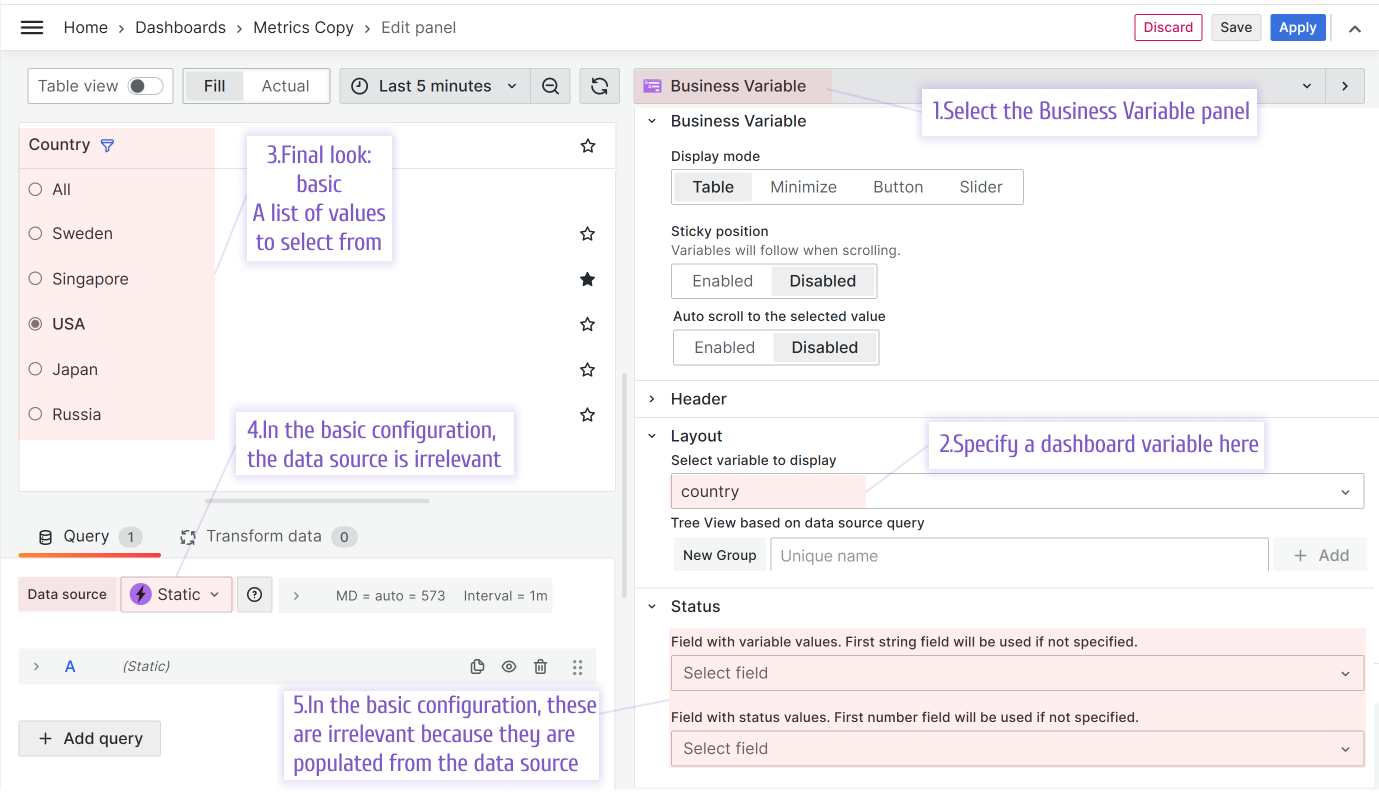
With minimal configuration, your Business Variable panel can display as a simple list. Whether multiple selections are allowed depends on the settings you choose in the variable configuration menu. In the following example, multiple selections and the Include All option are allowed.
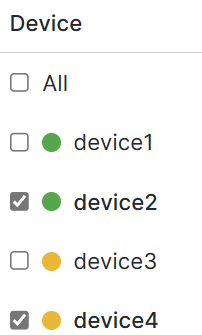
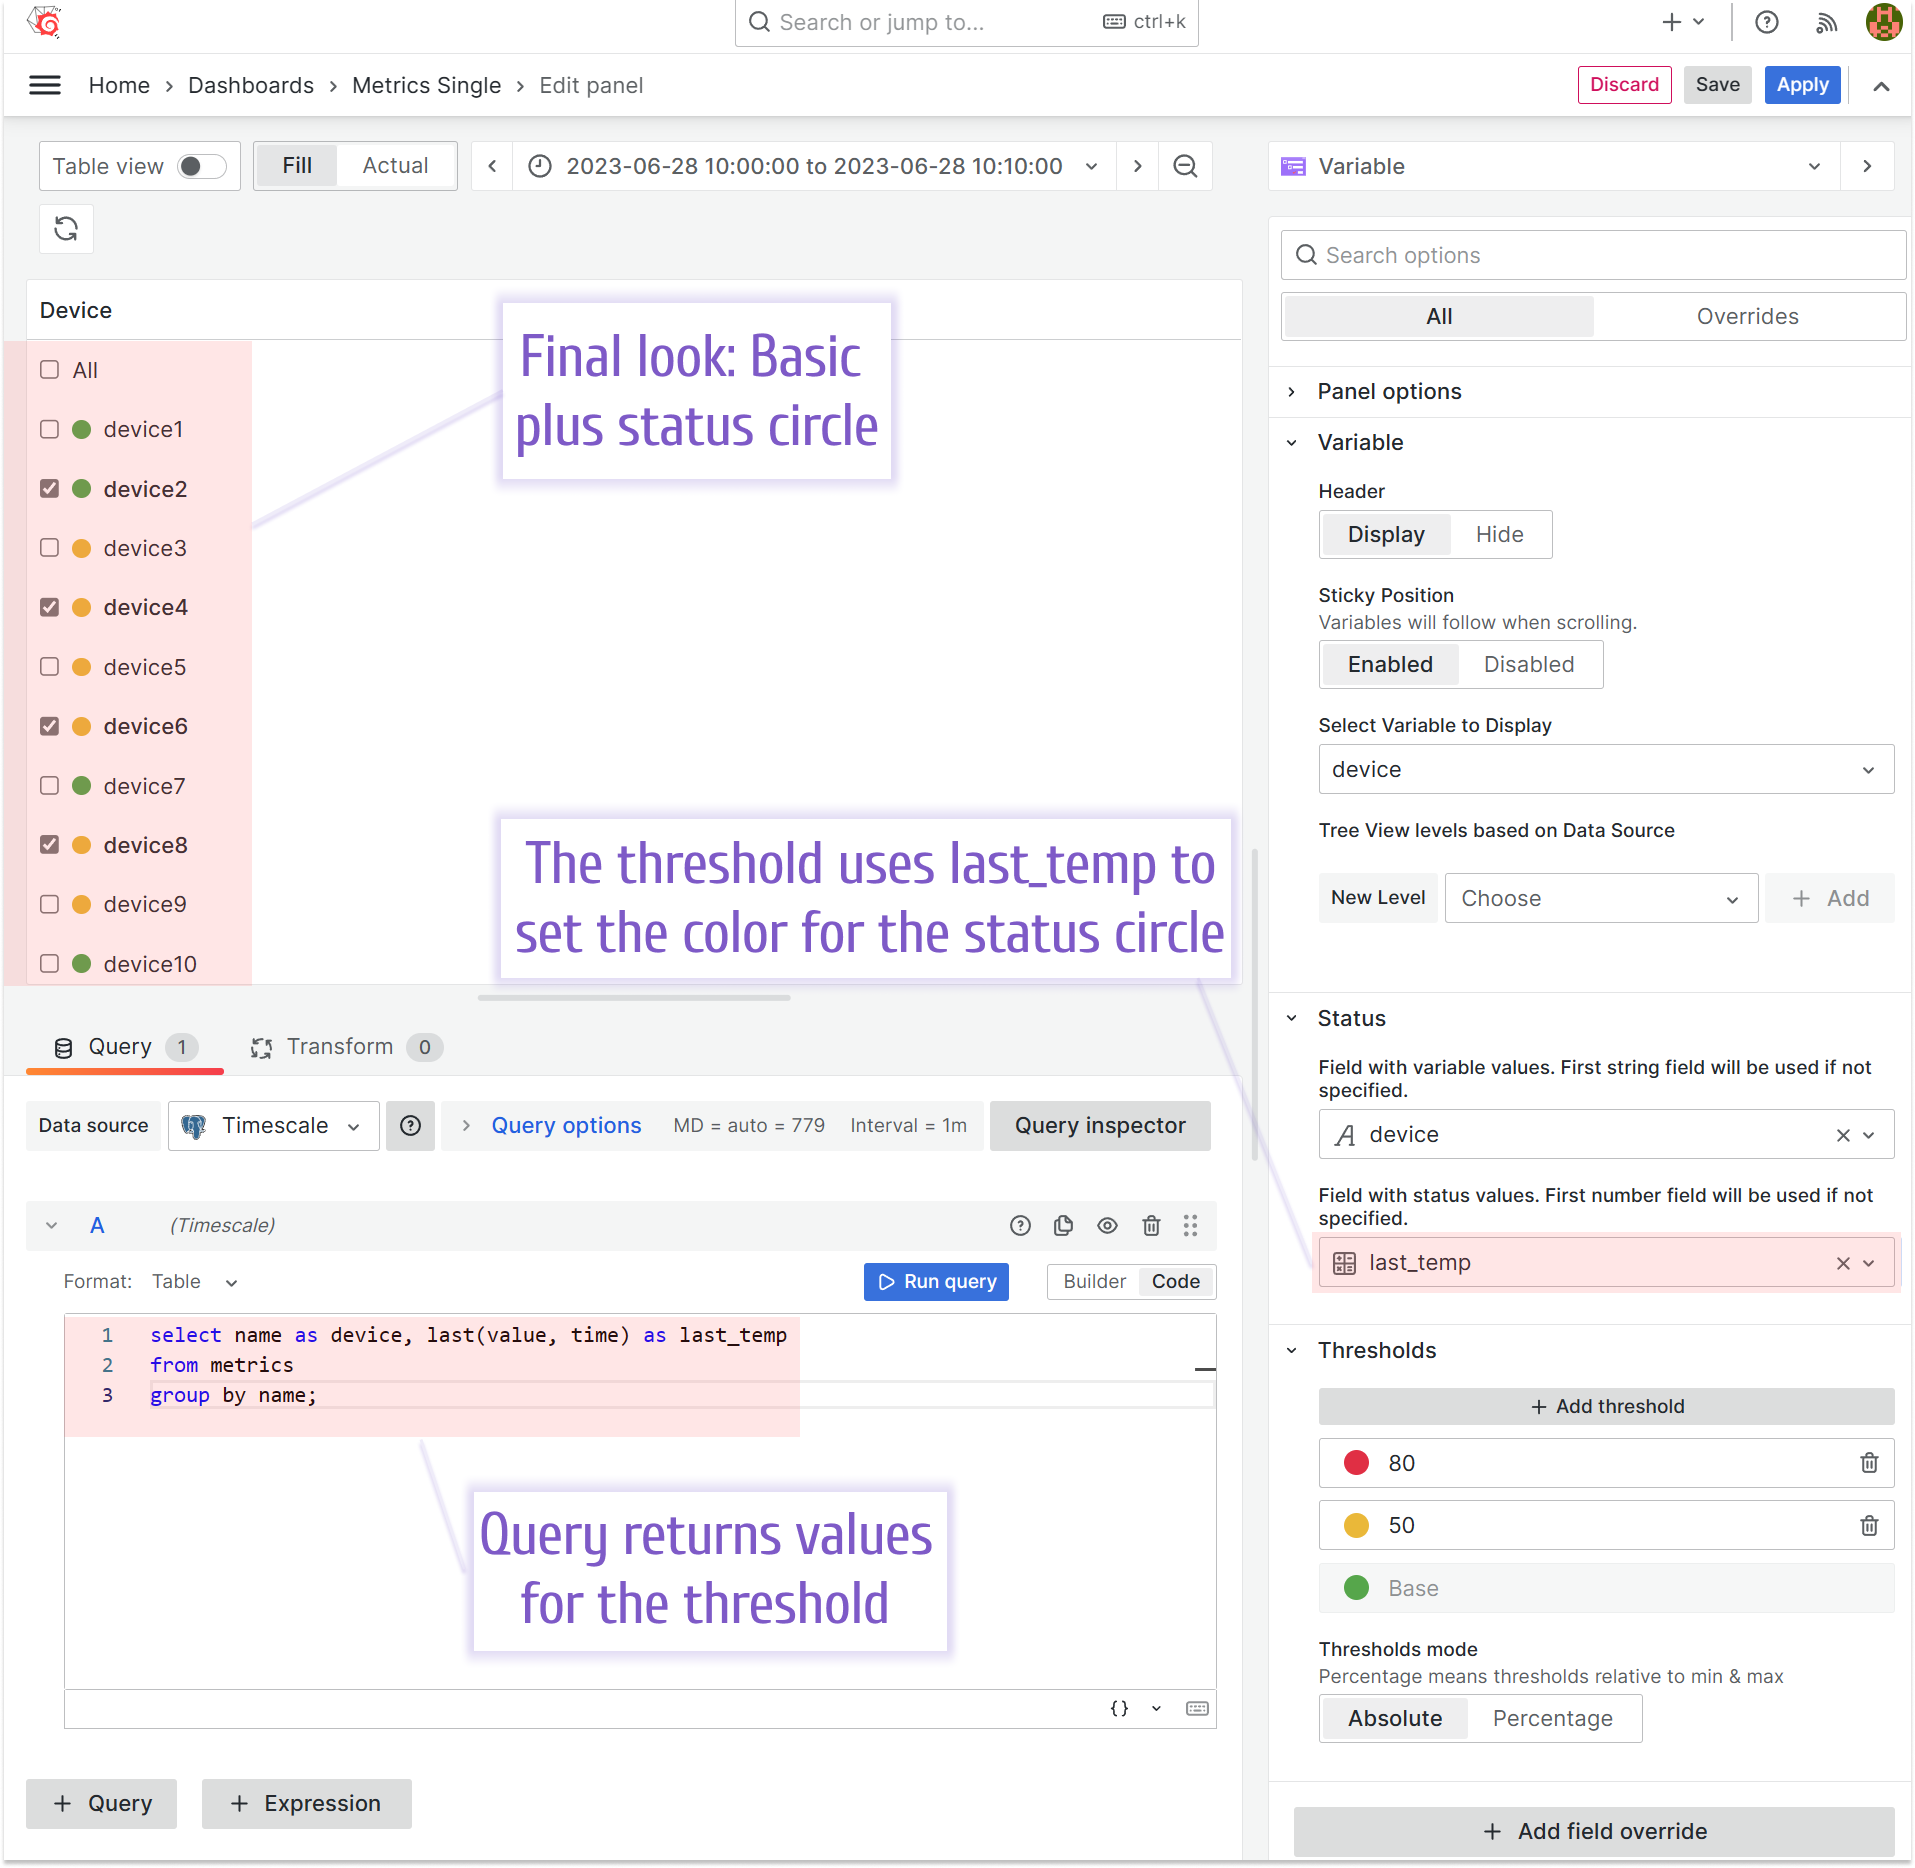
Single variable plus statuses
To add a status circle, complete the following steps:
- Connect the data source that retrieves two fields: a variable name and a numeric value.
- Configure thresholds by specifying colors for data ranges.
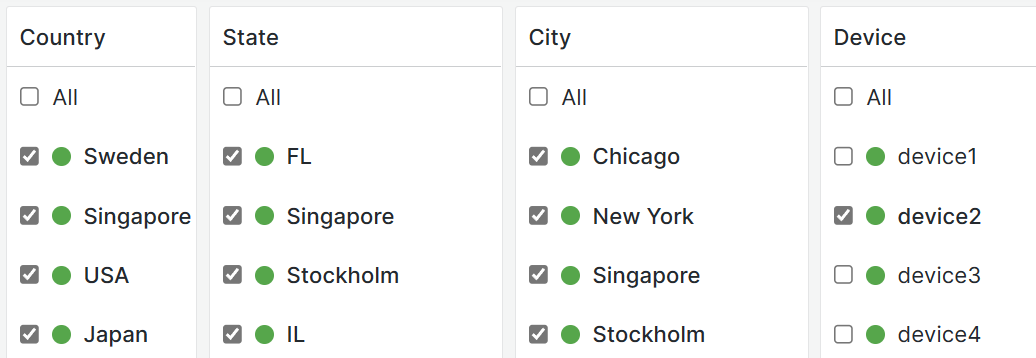
Multiple variables view
This configuration is similar to the previous one. The differences are:
- The dashboard variables connect to one another.
- Every level selection is a separate Business Variable panel.
TreeView
You can display the Multiple variables view as a TreeView structure.
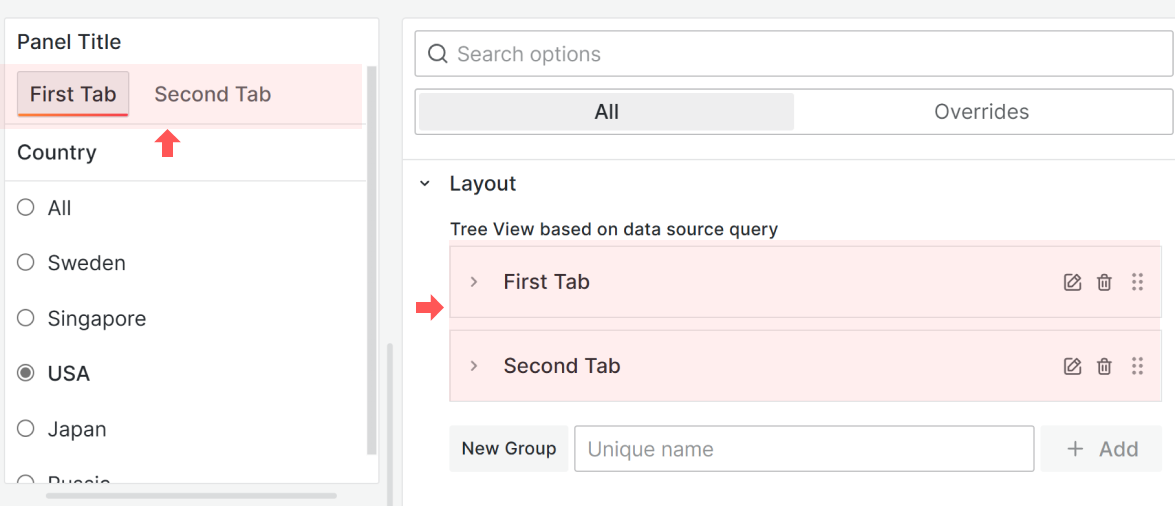
The TreeView display mode consists of groups, which are usually called tabs. Start by creating at least one New Group and assigning a dashboard variable to the Select variable to display parameter.
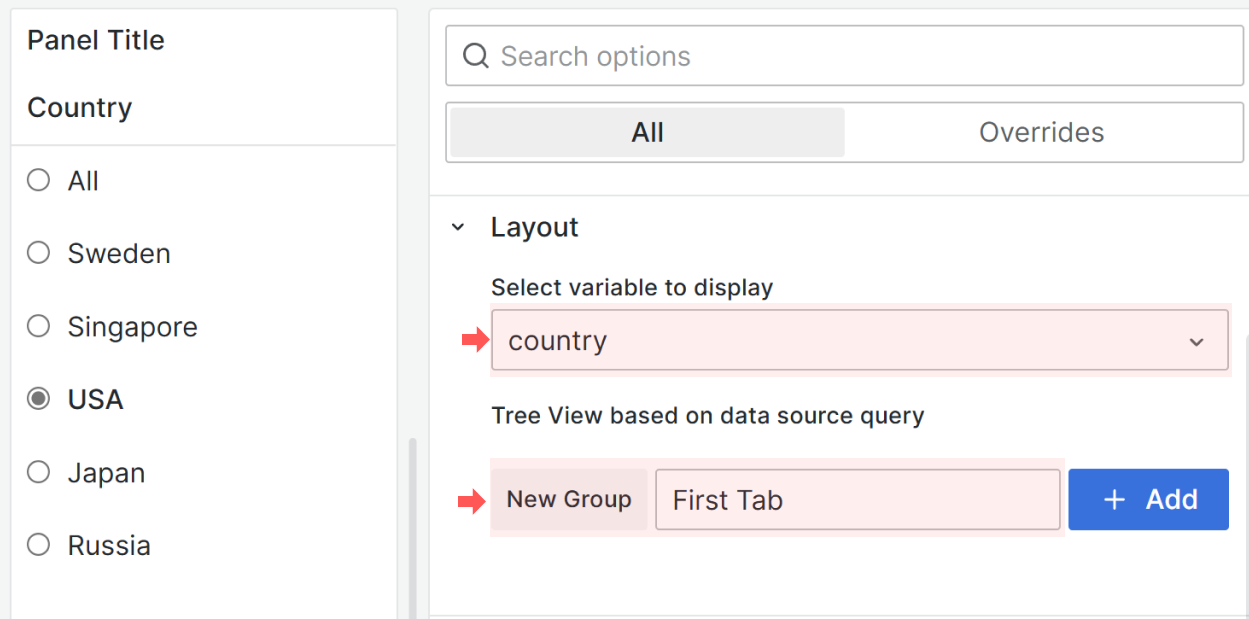
To display tab names, add at least two tabs.
TreeView levels
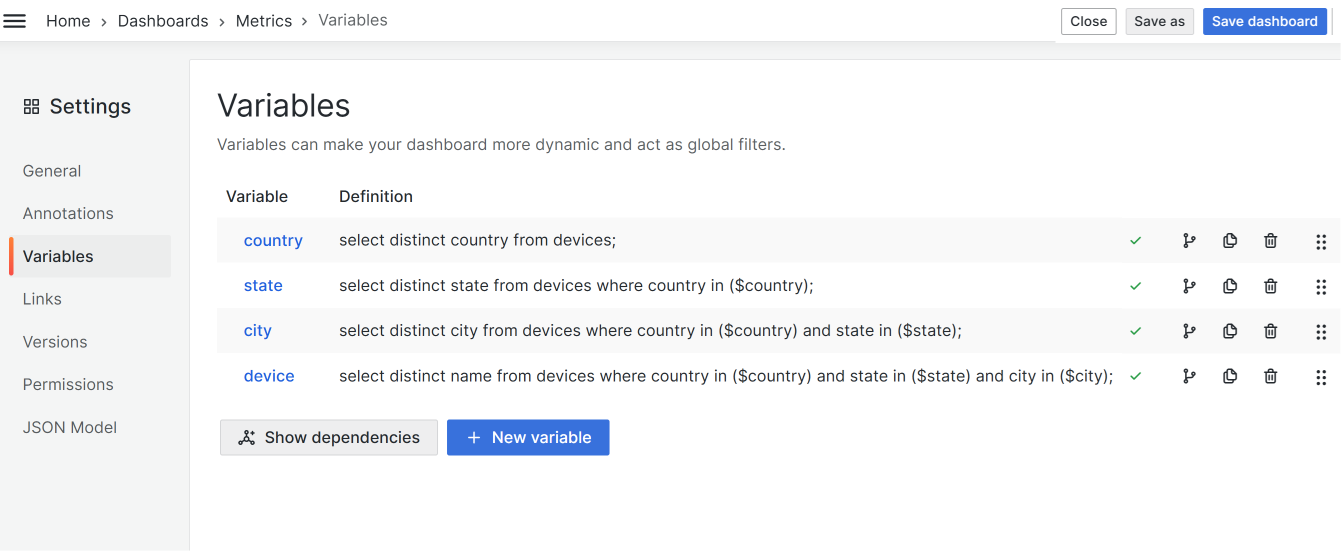
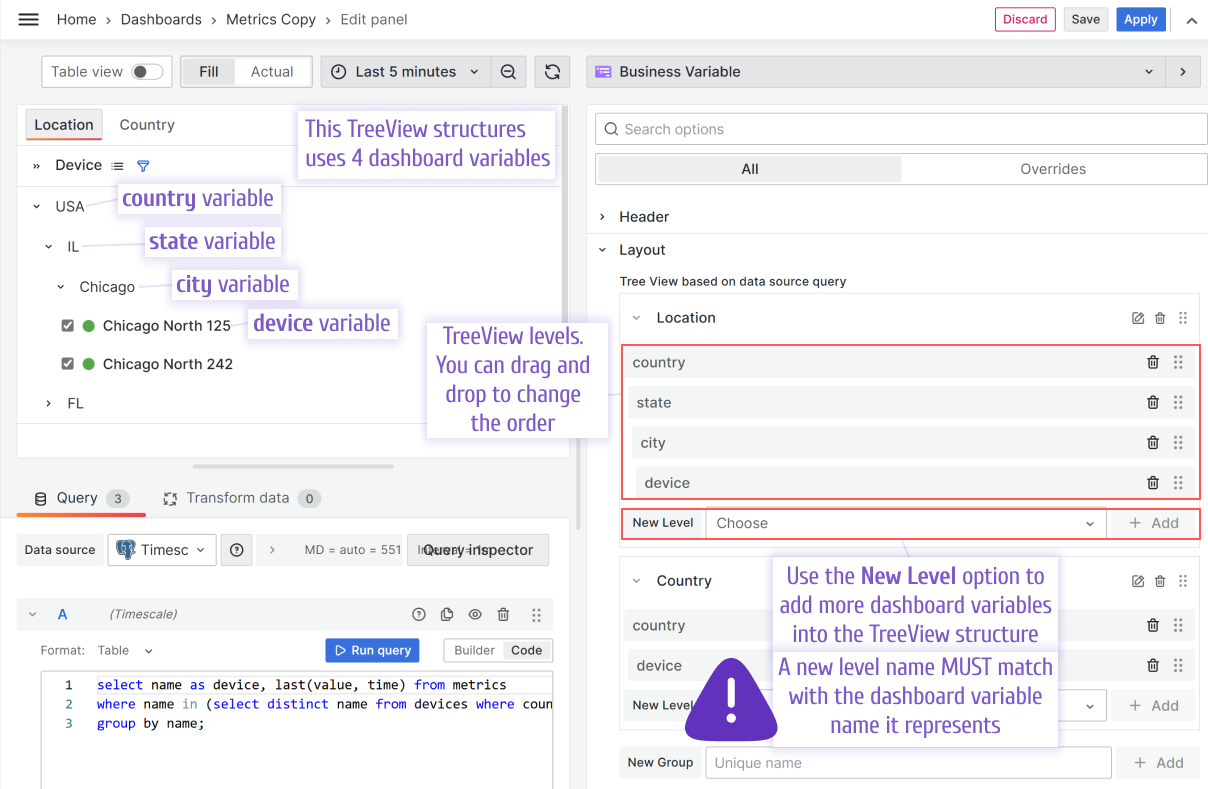
To create a TreeView with levels, create a dashboard variable for each level.
For example, to create a four-level TreeView (Country > State > City > Device), you need four dashboard variables:
countryis the first TreeView level.staterepresents the second level and updates with everycountryrefresh.cityis the third level and updates with everystateorcountryrefresh.deviceis the fourth level and updates with everystate,country, orcityrefresh.
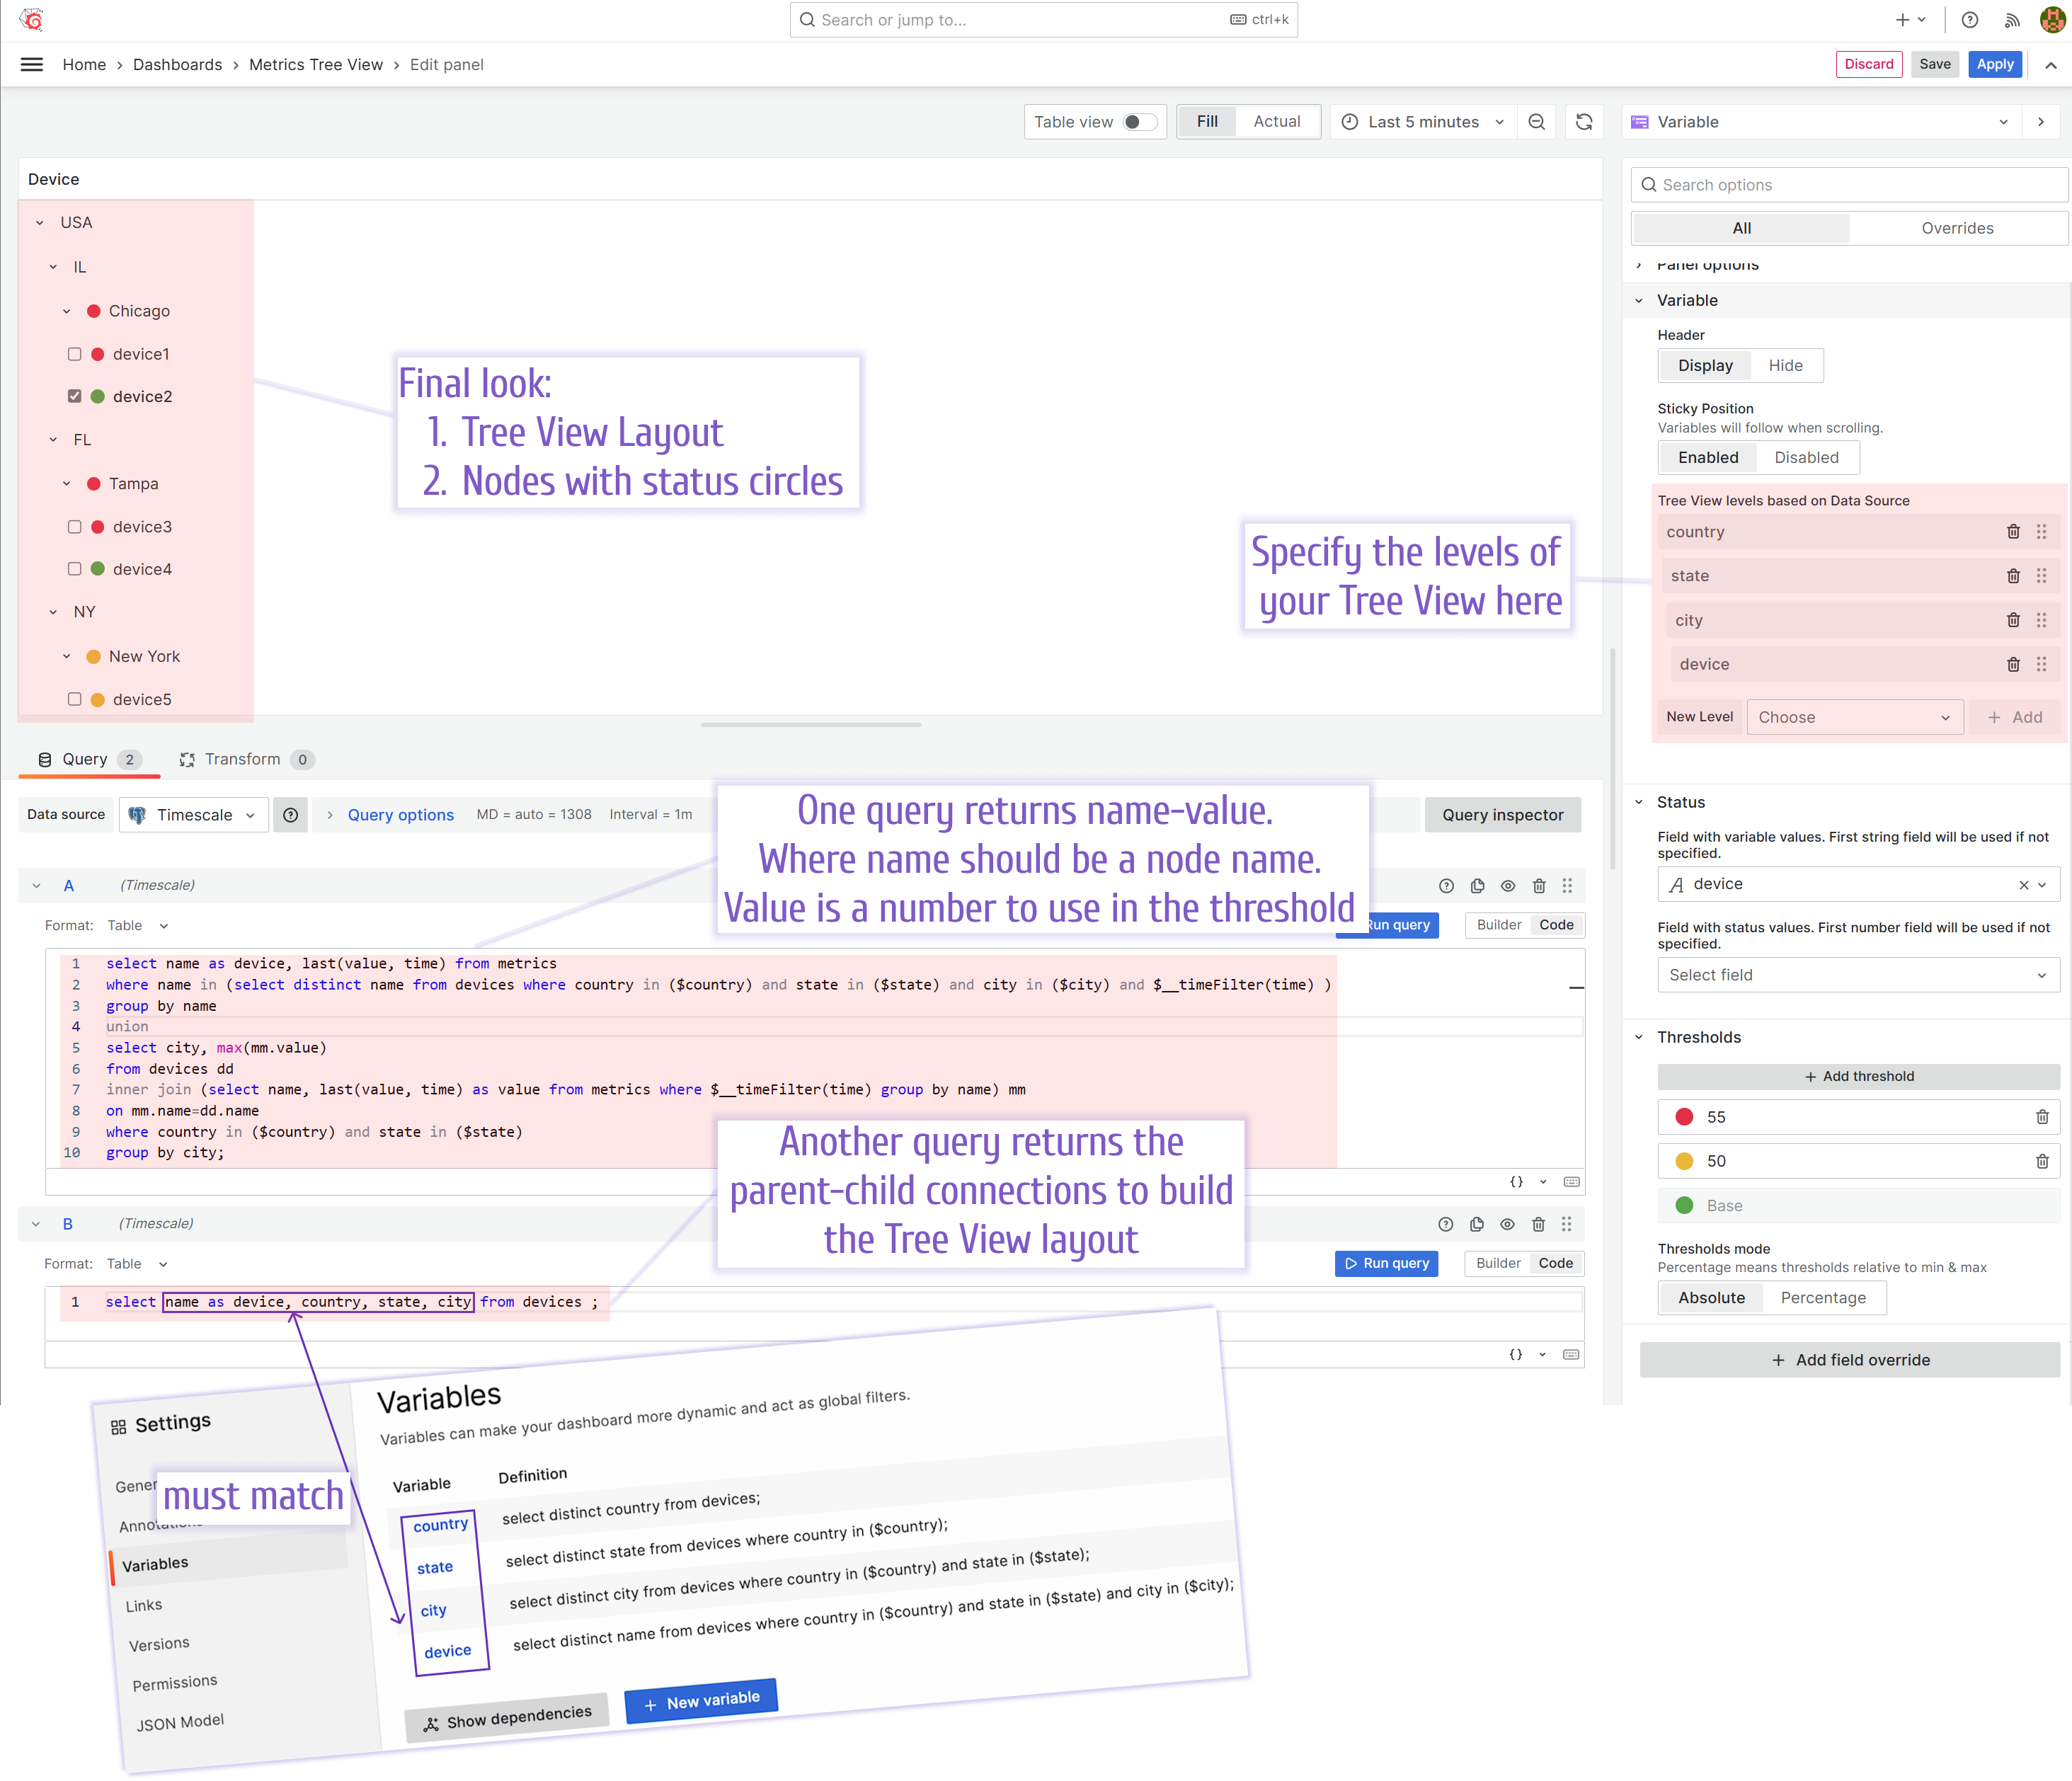
In the Business Variable panel options, add four TreeView levels. Ensure the level names match the dashboard variable names they represent.
The following example shows a TreeView with status circles.
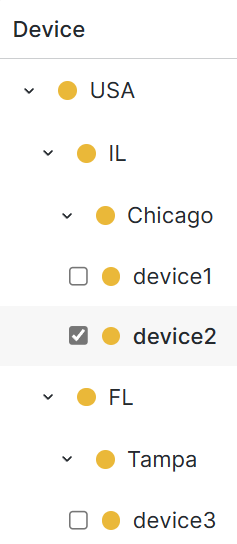
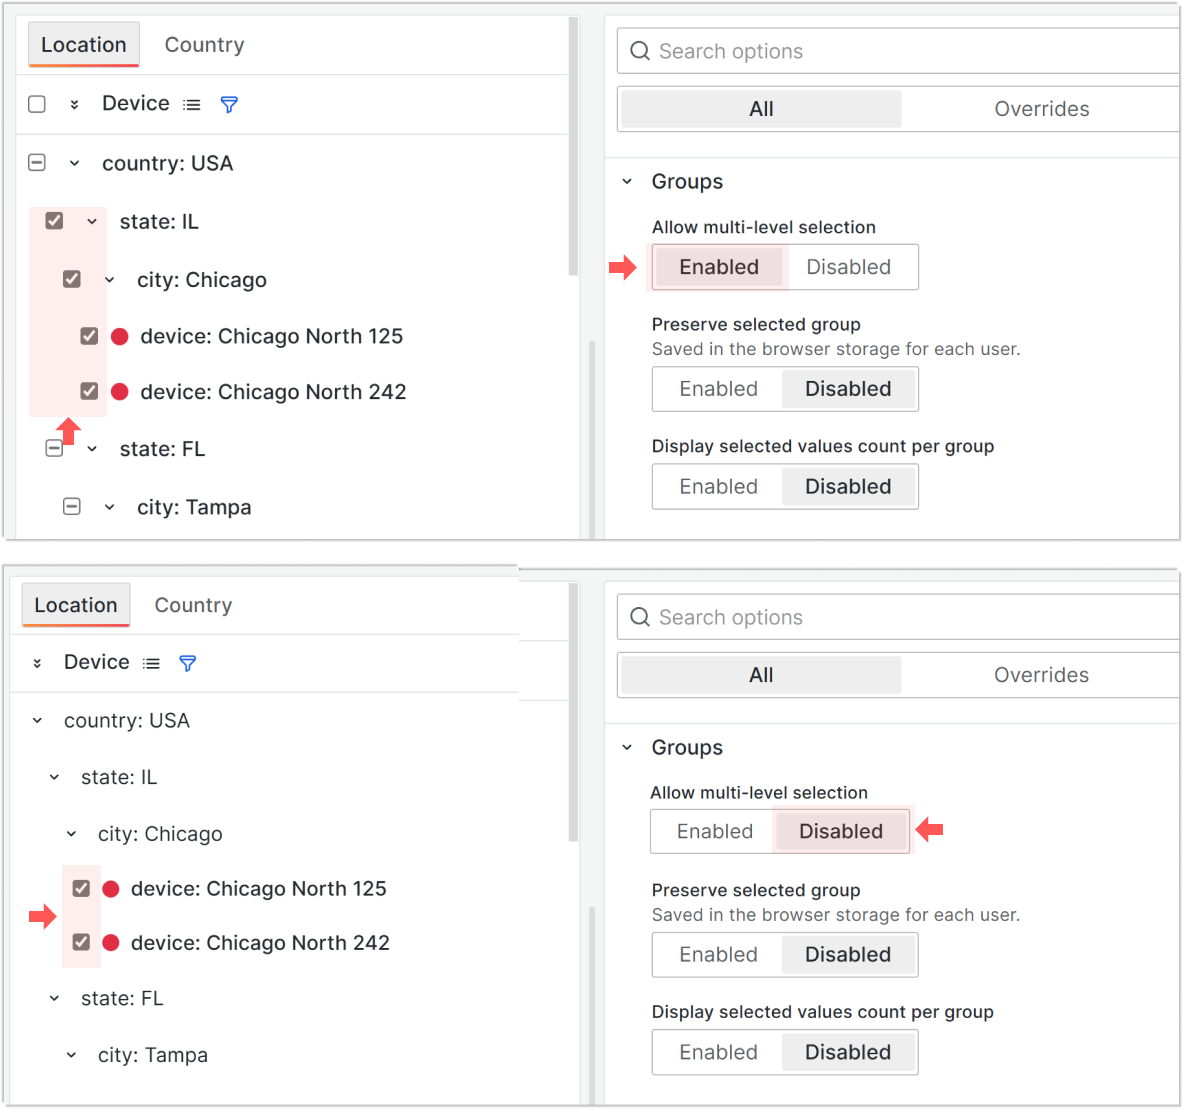
Multi-level selection
In the Groups category, when you enable the Allow multi-level selection parameter, selecting a group root automatically selects all elements in the group.
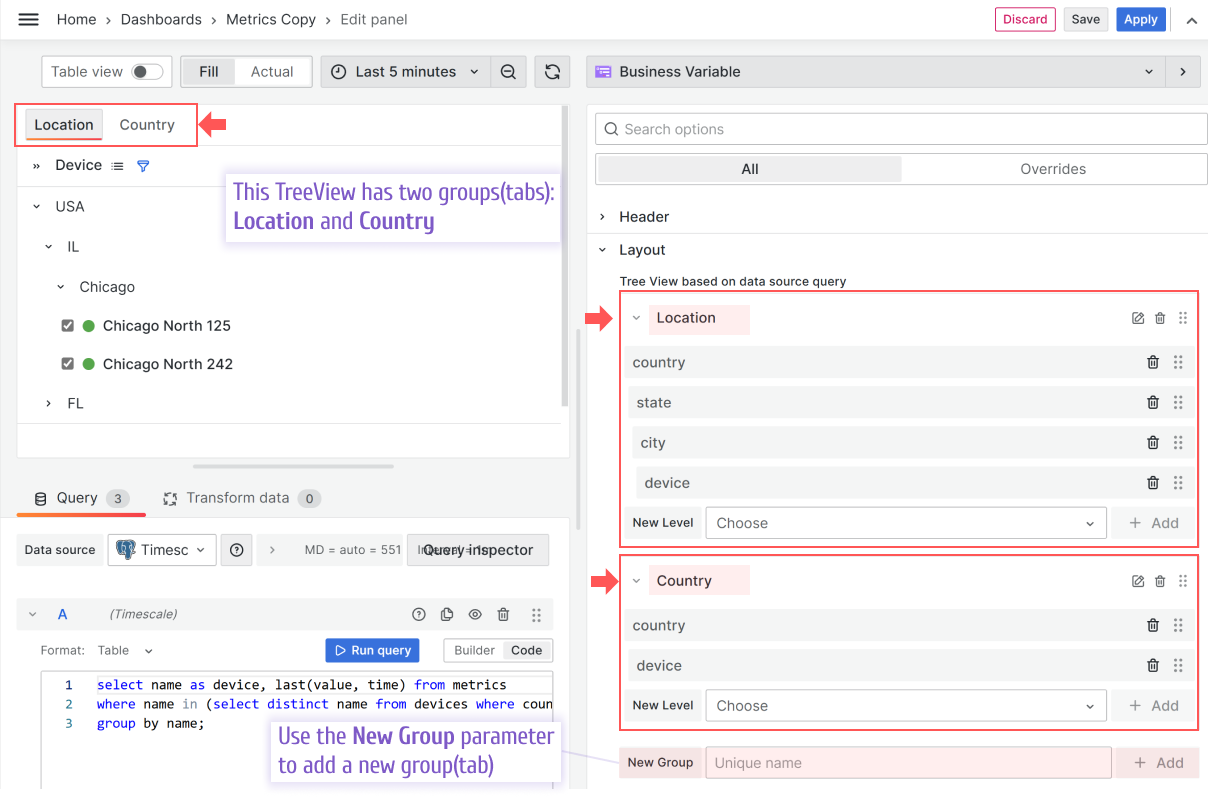
TreeView groups and tabs
The following TreeView has two groups or tabs. To add a new group or tab, use the New Group parameter.
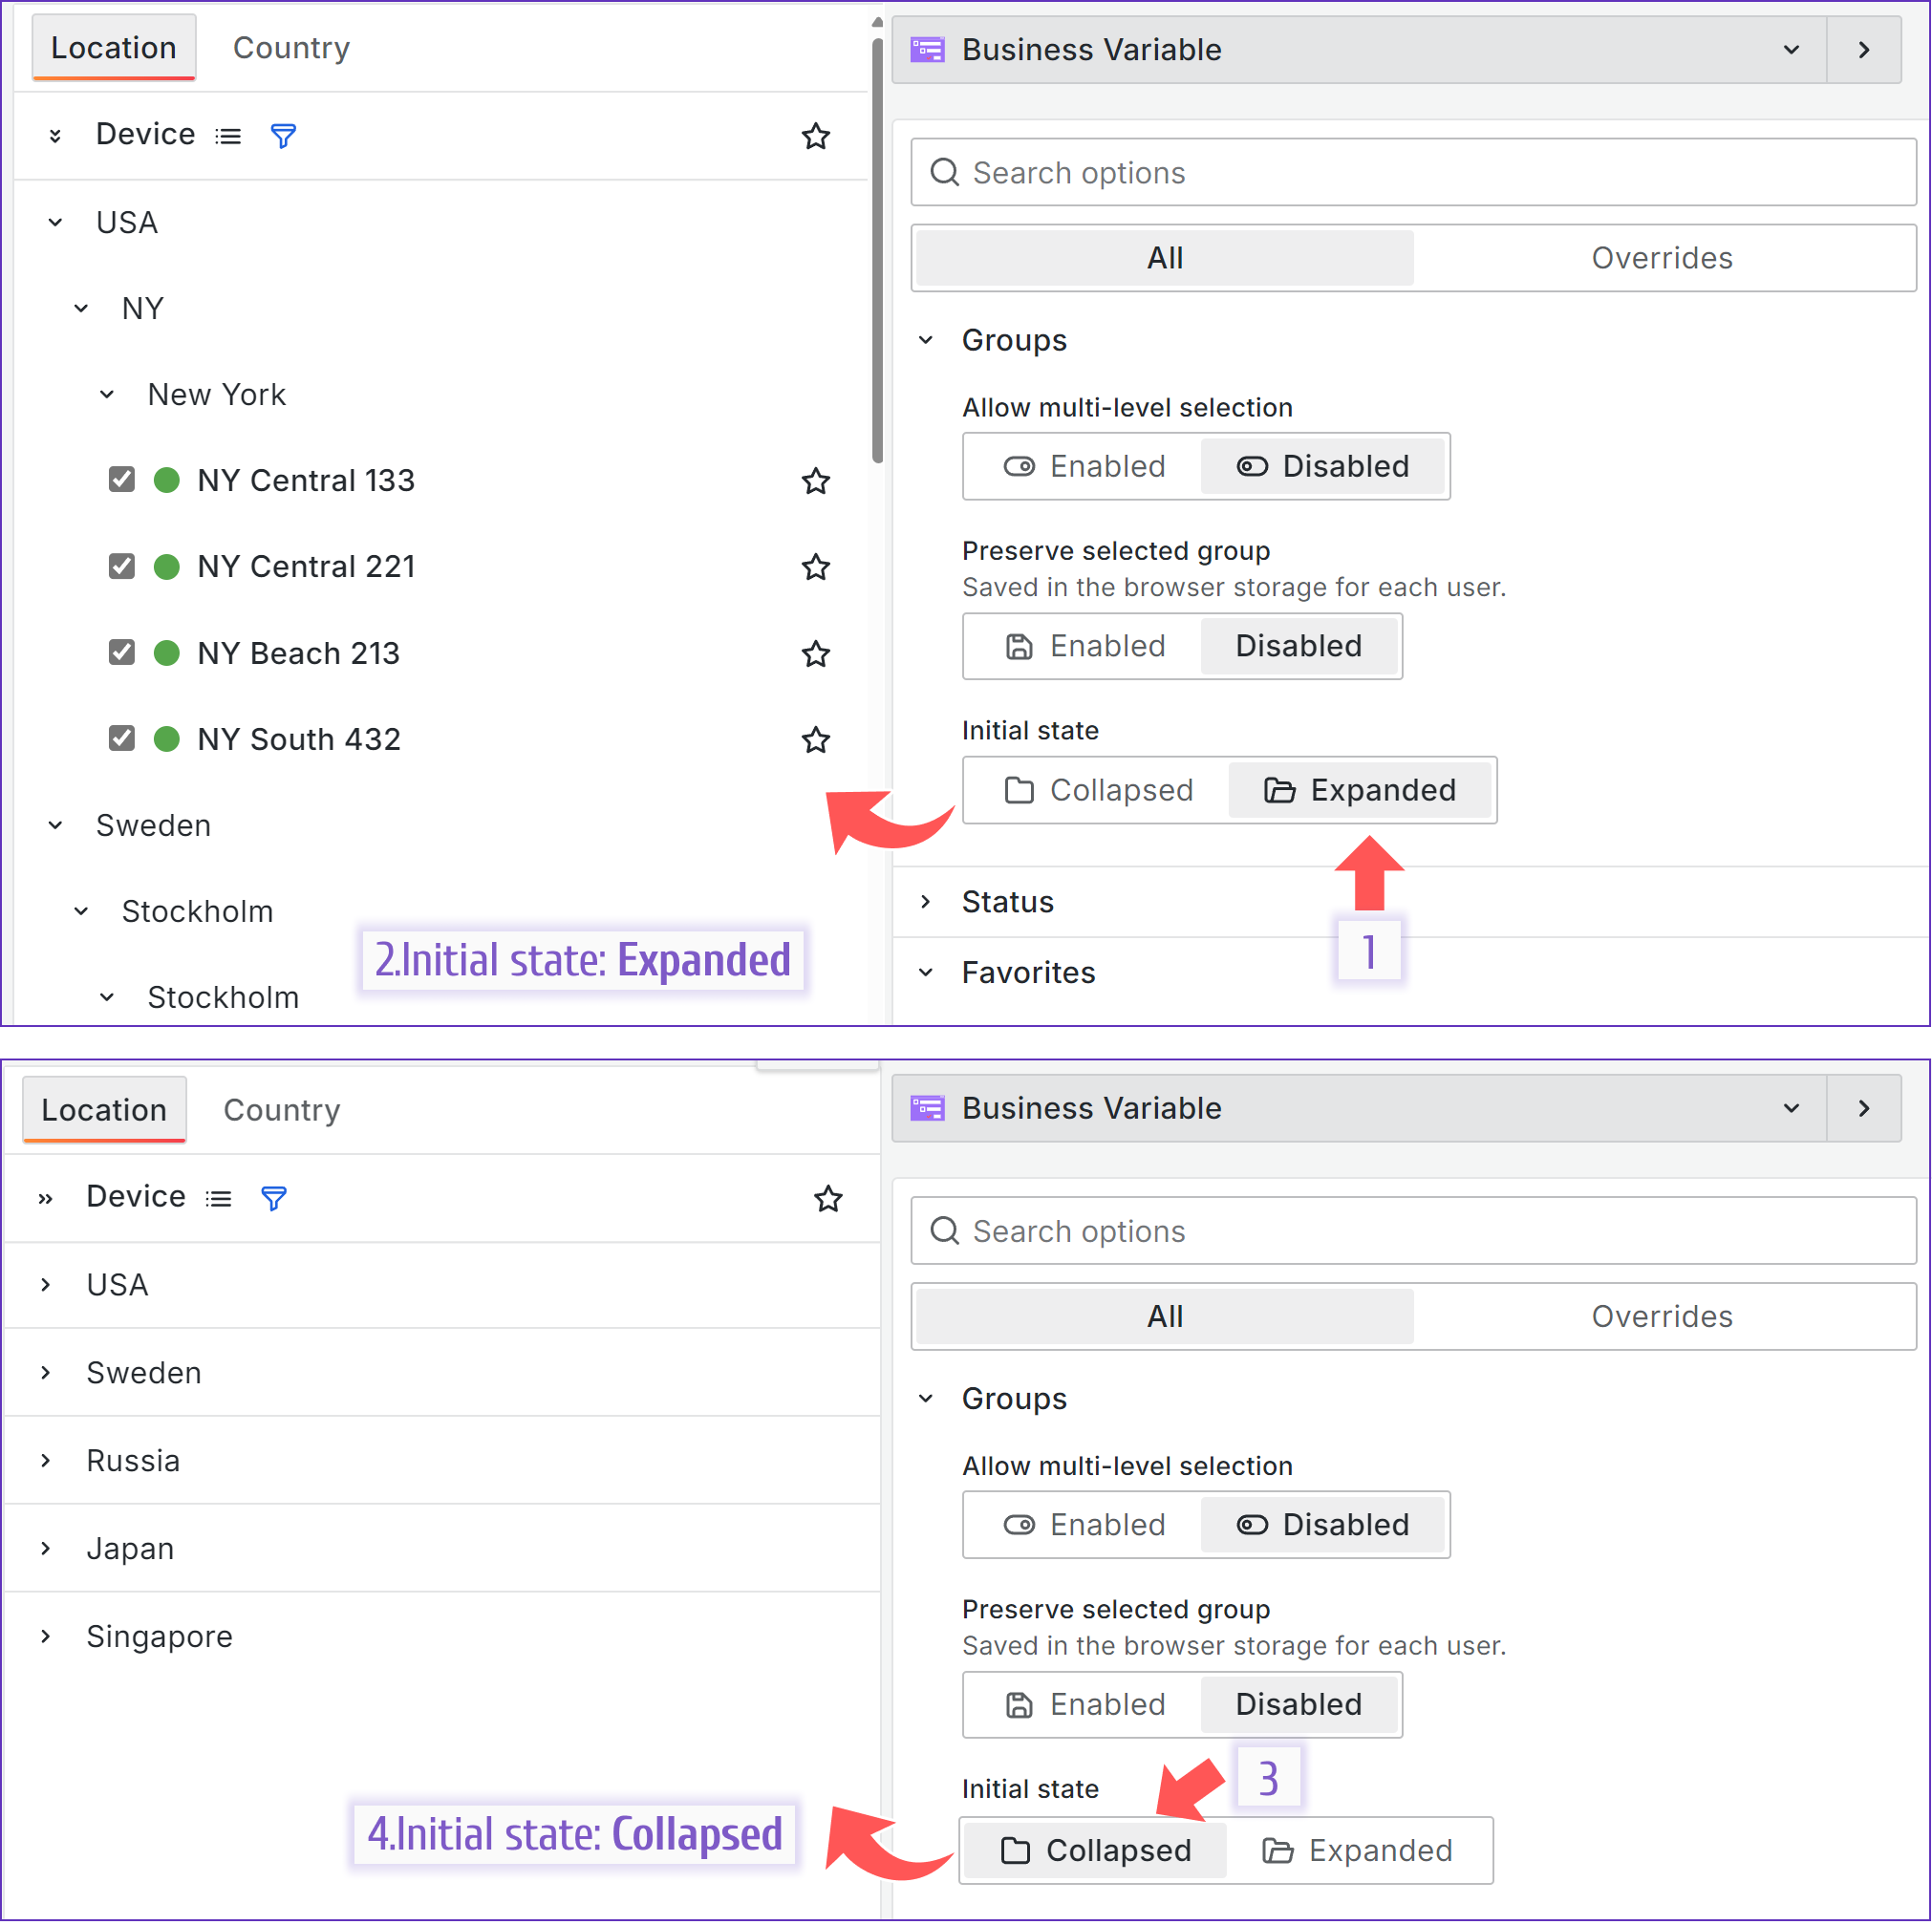
Collapse and expand on initial load
Note
The Business Variable supports the Collapse/Expand feature starting from version 3.4.0.
You can control how your TreeView appears when the dashboard opens.
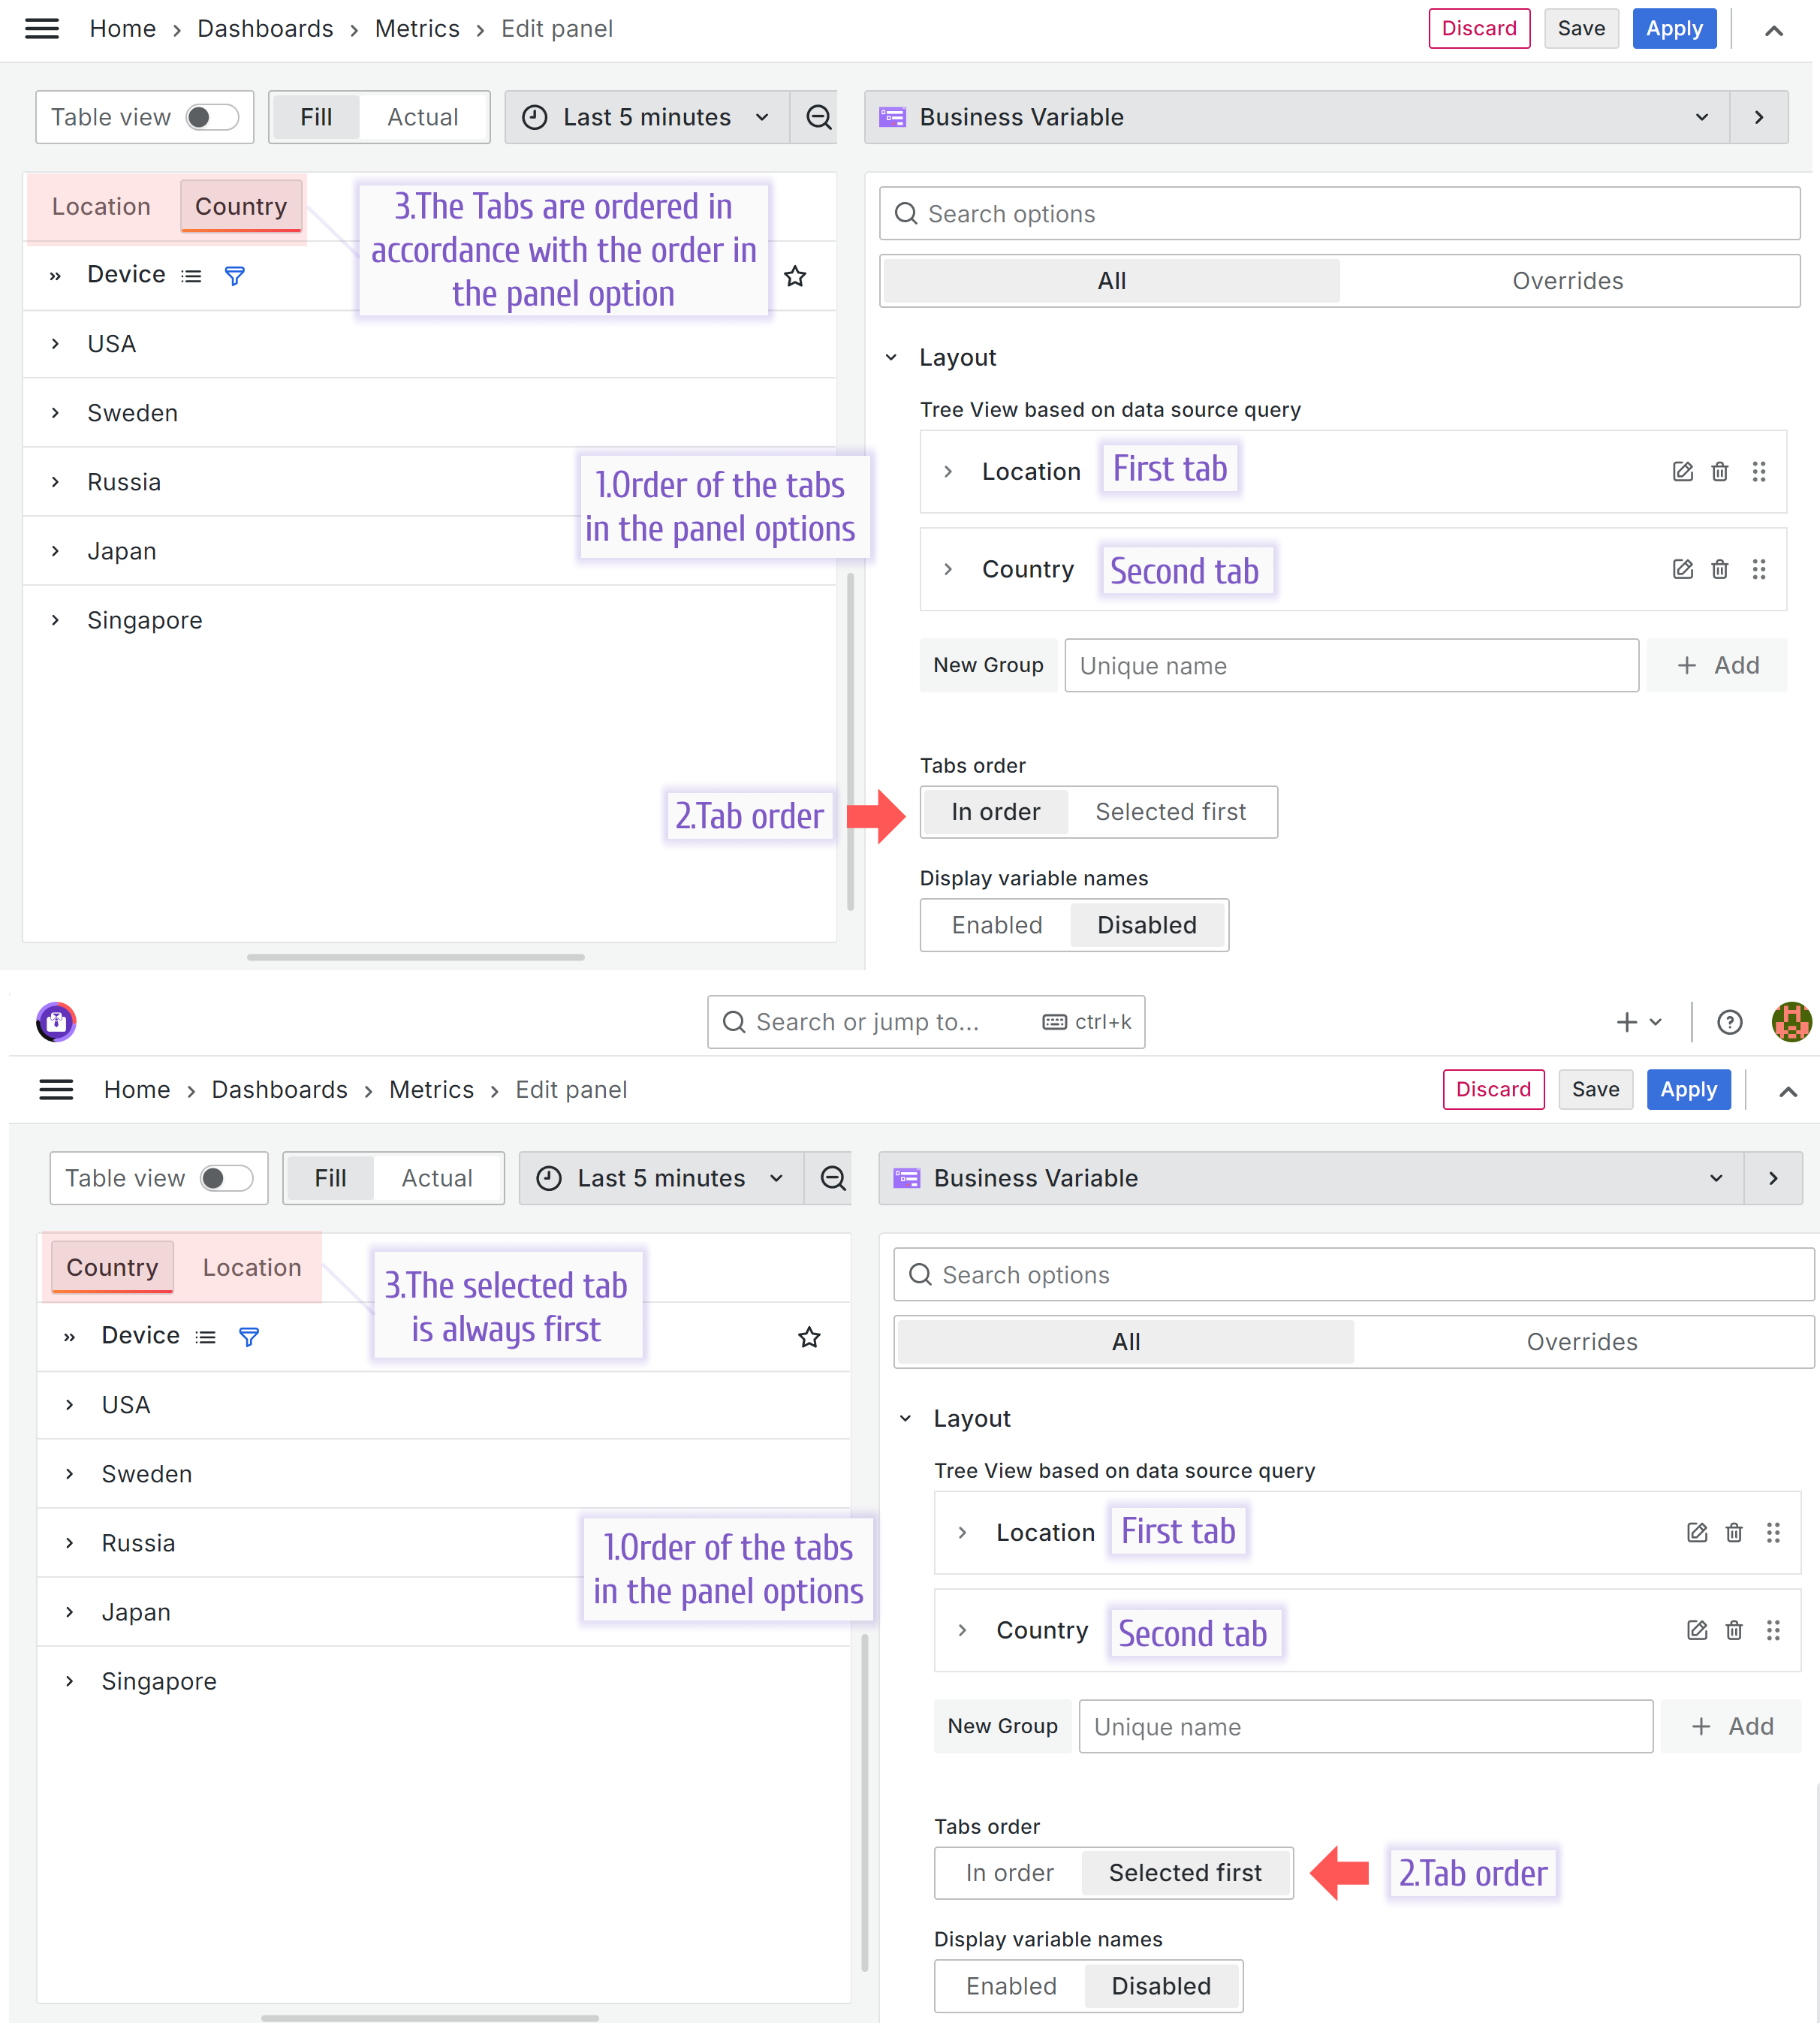
Tabs order
Note
The Business Variable supports the Tabs order feature starting from version 3.4.0.
When you have multiple tabs, you can specify their order in the Tab order parameter:
- In order: The tabs always appear in the same order as they appear in the panel options.
- Selected first: The selected tab always appears first.
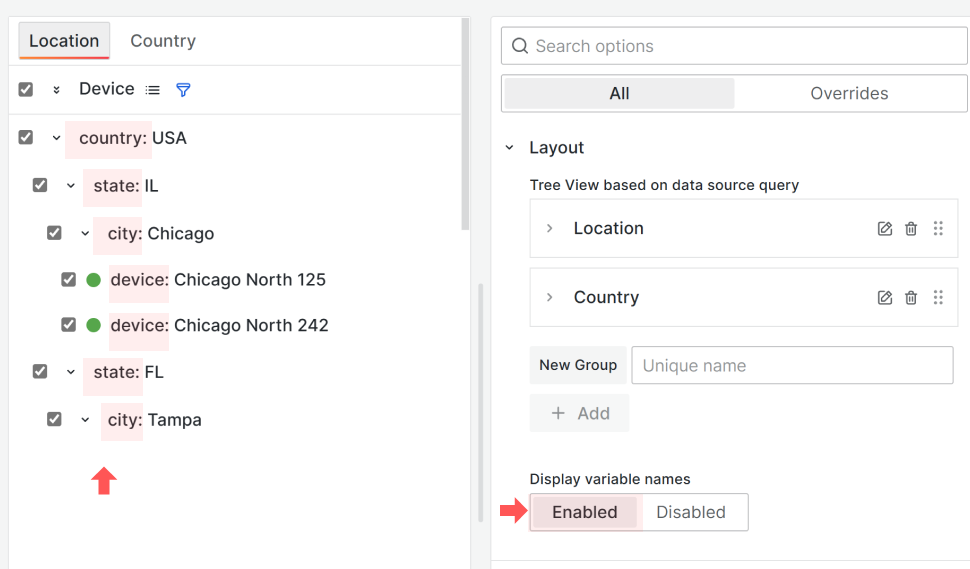
Dashboard variable name display
You can enable an option to display the variable name in front of the value to provide additional context for users.
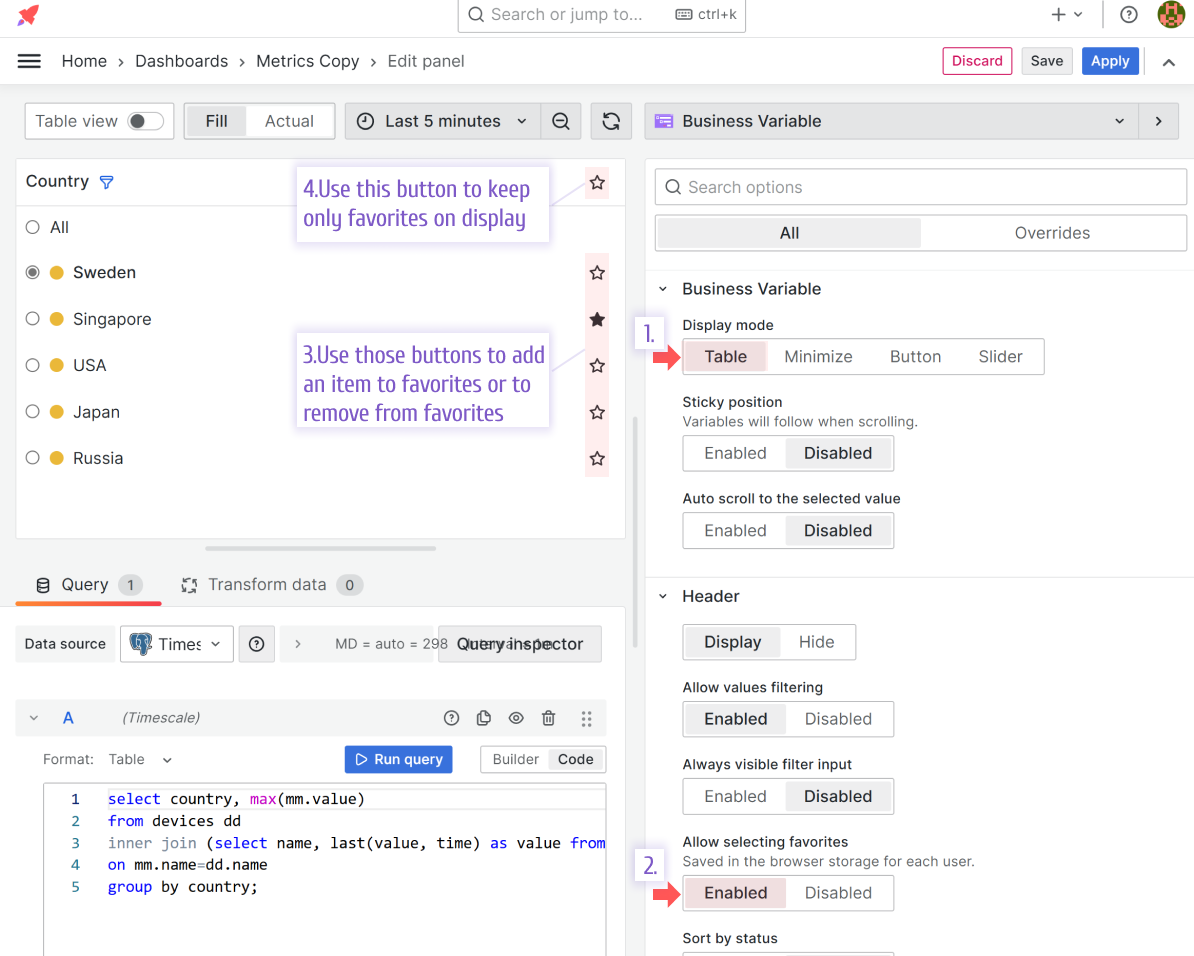
Favorites
The Business Variable panel lets you select values as favorites. The favorite icon in the header lets you filter all favorites for quick navigation and selection.
Note
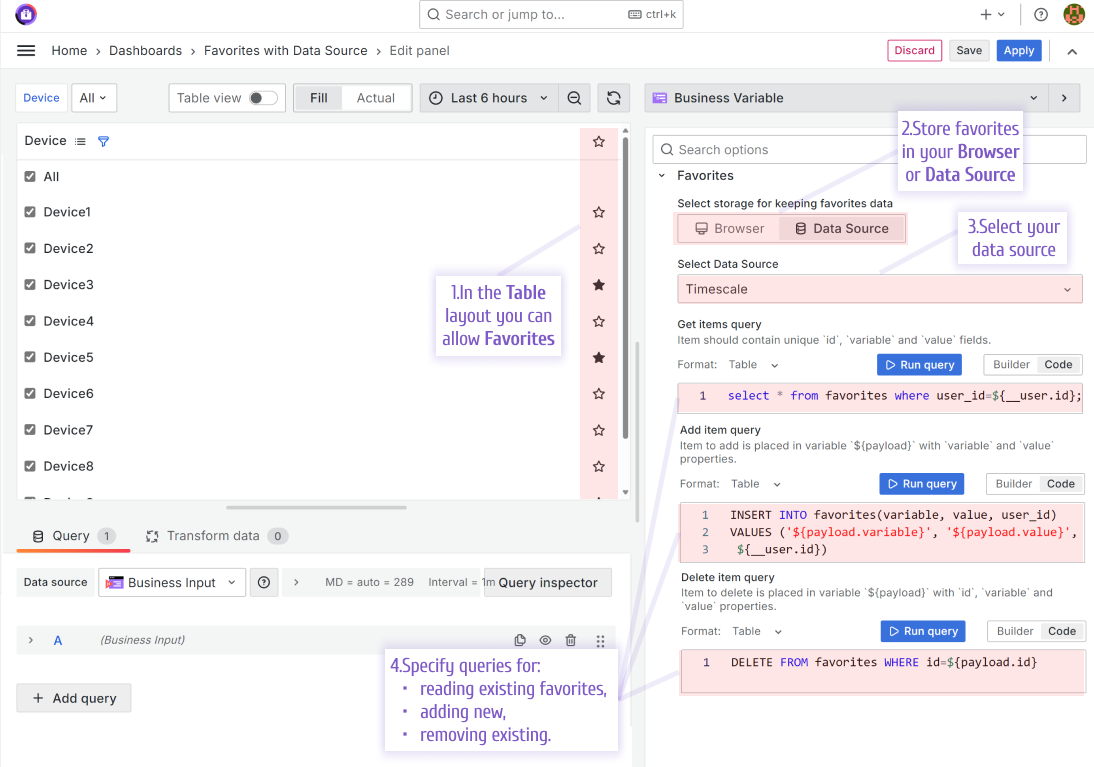
Before version 3.4.0, you could only store favorites in a web browser. Starting from version 3.4.0, you can also store favorites in a data source.
Store favorites in a data source
Storing favorites in the browser works well in many cases. All favorites are unique for each user.
However, some users work with Grafana dashboards on multiple devices and browsers or need to clear their cookies frequently.
These users can store their favorites in a data source.
SQL to create the table in the following example:
CREATE TABLE favorites (
    id serial primary key,
    variable text NOT NULL,
    value text NOT NULL,
    user_id integer NOT NULL
);
Example of favorites table data:
Get items query
select * from favorites where user_id=${__user.id};Add item query
INSERT INTO favorites(variable, value, user_id)
VALUES ('${payload.variable}', '${payload.value}', ${__user.id})
Delete item query
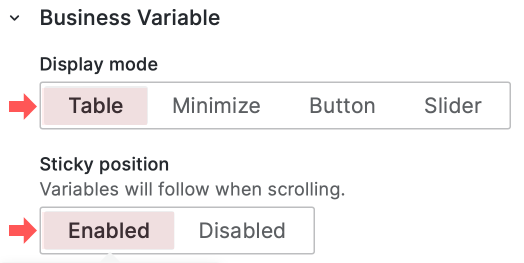
DELETE FROM favorites WHERE id=${payload.id}Sticky option
Enable the Sticky option to keep the Business Variable panel in sight. The panel won’t scroll out of view.
Search
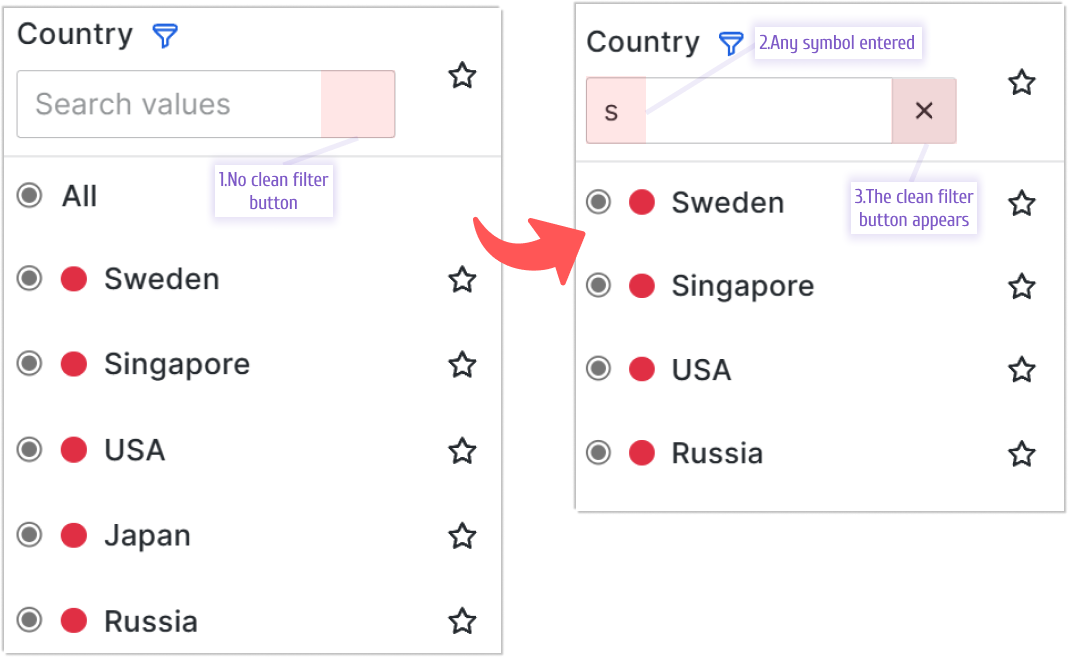
Clean filter value button
Note
The Business Variable panel supports this feature starting from version 2.2.0.
When you start typing in the search text field, you can remove all entered characters by clicking the X button that appears in the far-right corner of the search field.
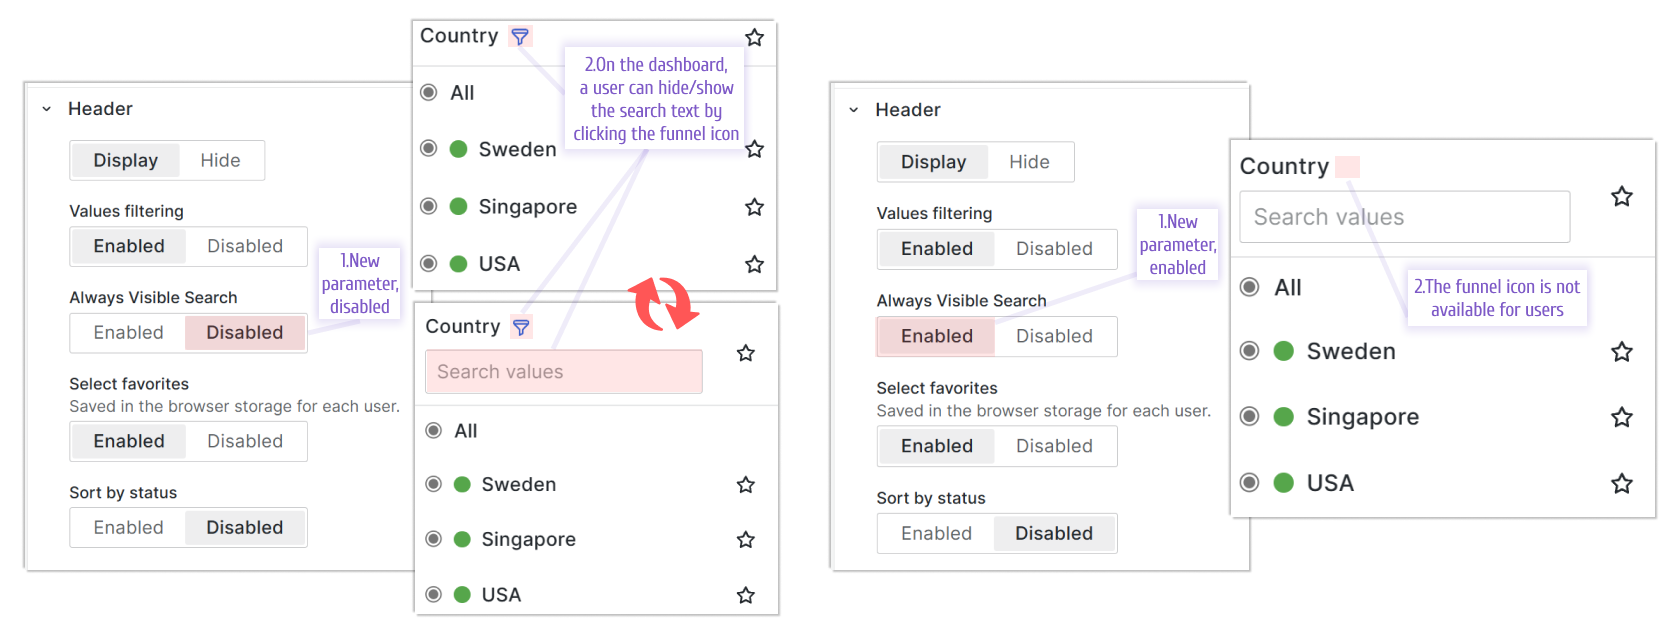
Always visible search option
Note
The Business Variable panel supports this feature starting from version 2.2.0.
You can use the Always Visible search option to prevent users from hiding the search text area.
When this option is Disabled, the funnel icon appears on the dashboard. Users can click the funnel icon to show or hide the search text area.
When this option is Enabled, the funnel icon is hidden and users can’t hide the search text area.
Total and selected values count
Note
The Business Variable panel supports this feature starting from version 3.0.0.
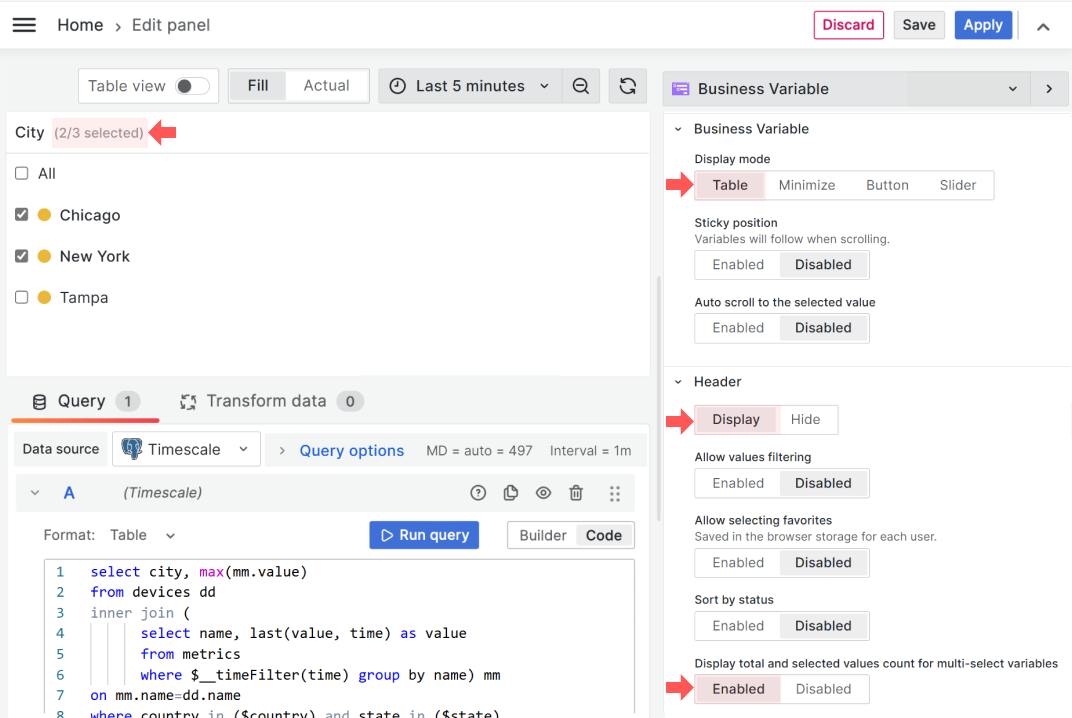
In the Table display mode, you can choose to display total and selected values count for multi-select variables. To see this parameter, set Header to the Display mode.
This parameter enables or disables the count display. The total count appears next to the header in gray text. The first number shows how many values are selected. The second number shows how many values are available for selection in total.
Tab auto-grouping
Note
The Business Variable panel supports this feature starting from version 3.0.0.
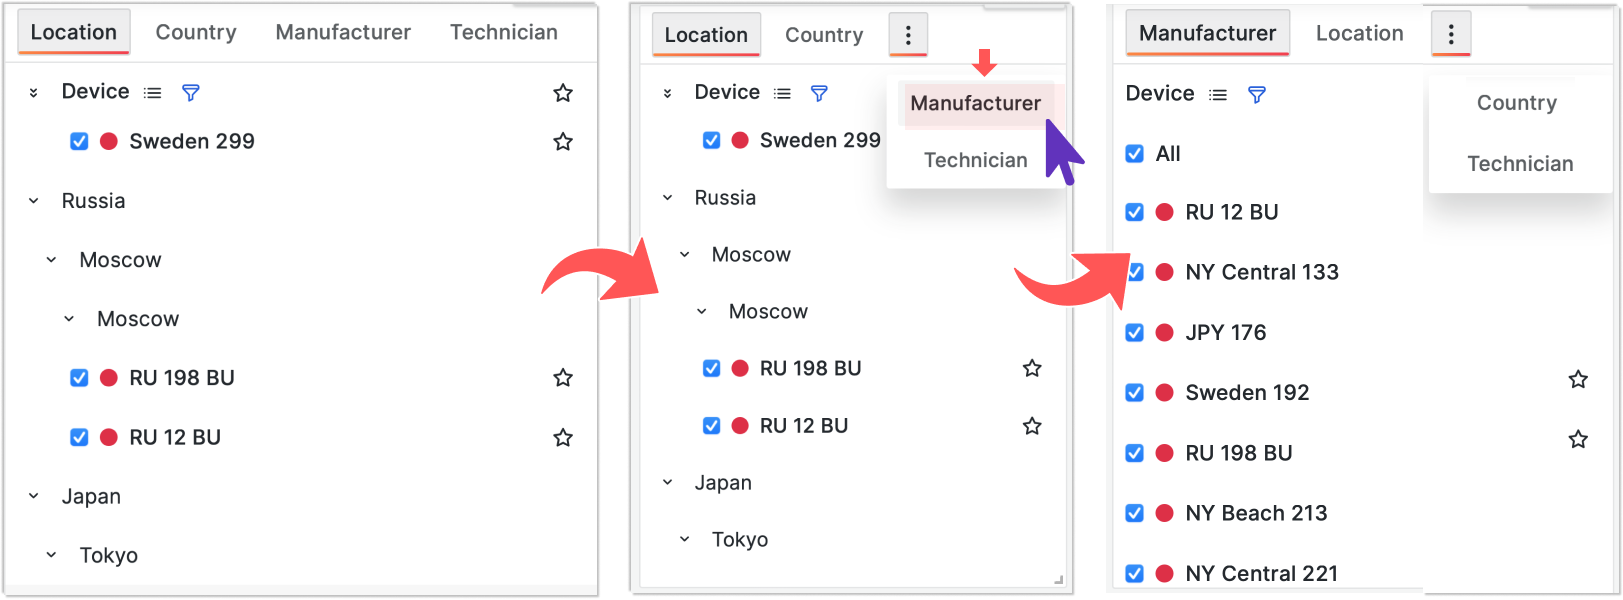
The auto-group tab feature adds more sophistication to the Business Variable panel. When too many tabs are side by side, the panel collects the overflowing tabs and displays three vertical dots instead. When you click the dots, you see the remaining tabs in a dropdown.
The Business Variable panel moves the selected tab to the far left among all other tabs.
Selected tab preservation
Note
The Business Variable panel supports this feature starting from version 3.0.0.
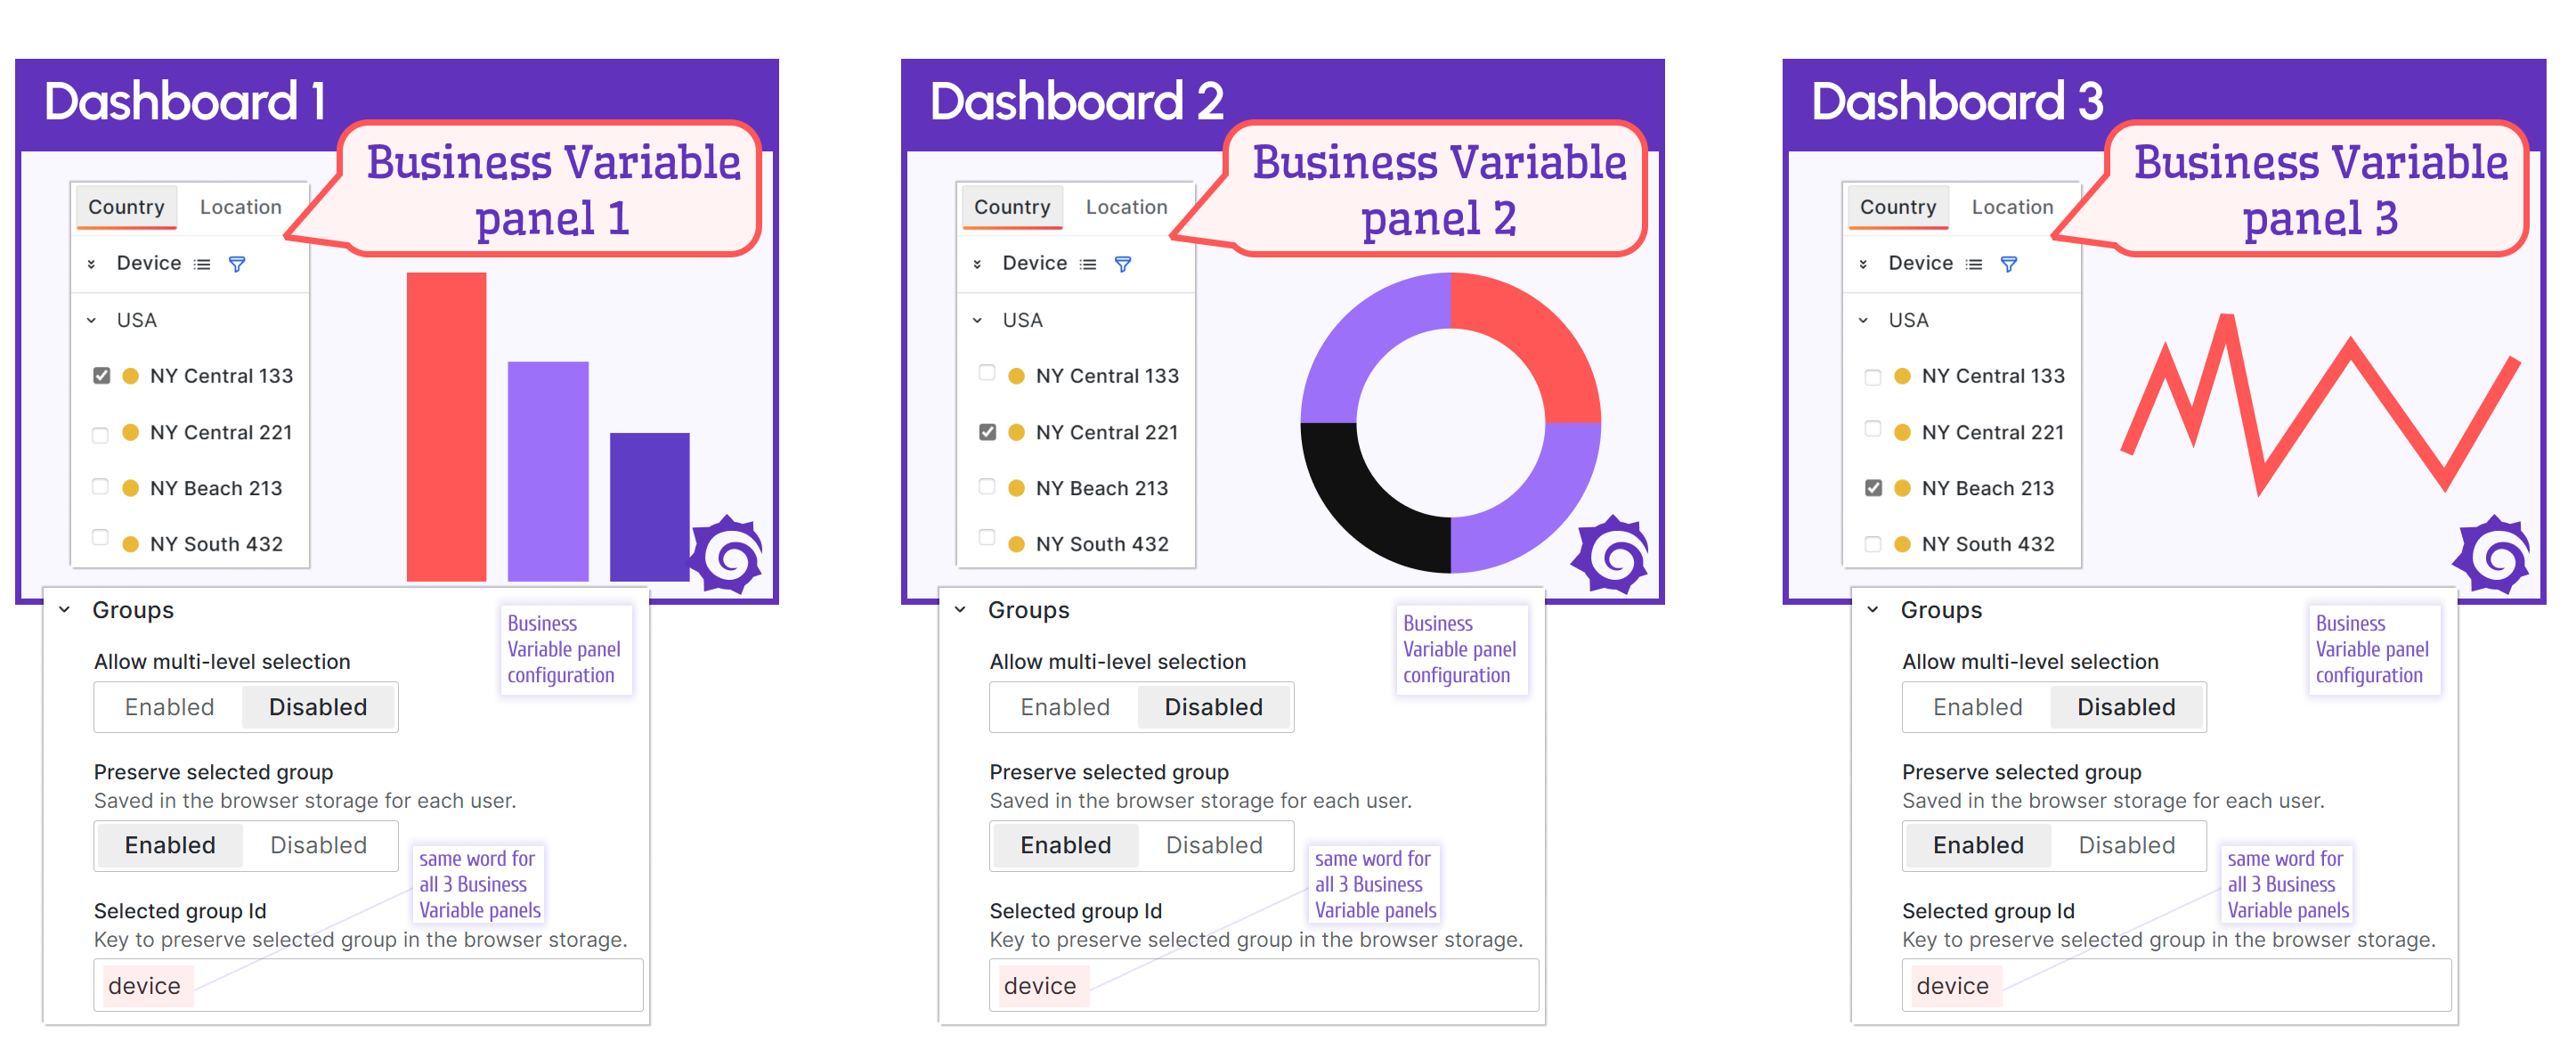
You might have cloned Business Variable panels across many dashboards. When you use this setup, users can switch to a different dashboard seamlessly. To enhance the user experience, you can save the selected tab when redirecting users and open the new dashboard with the previously selected tab.
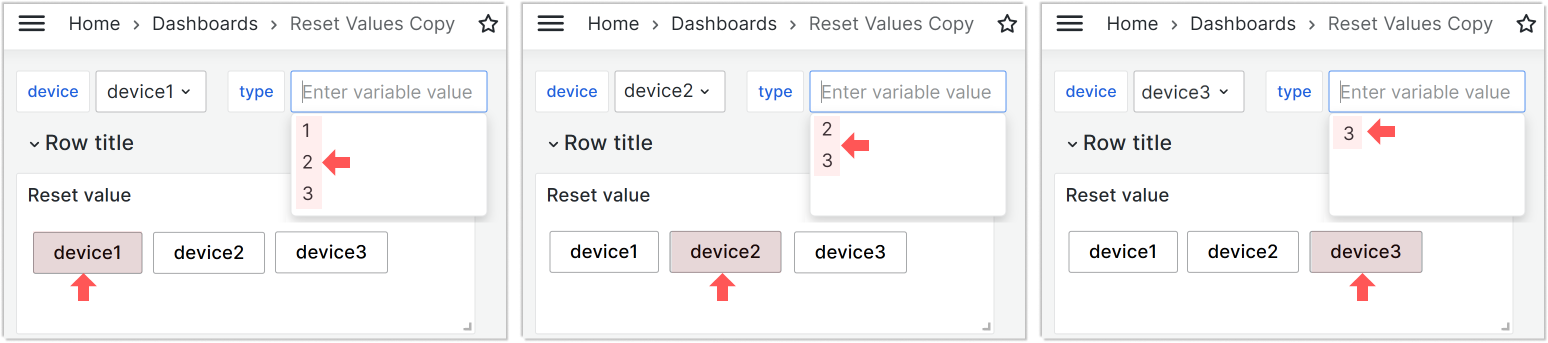
To configure tab preservation, use the Selected group id parameter from the Groups category. Choose a unique word and specify it across all dashboards where you have the Business Variable panel and need to preserve the selected tab.
In the following example, three different dashboards have an identical Business Variable panel. All three Business Variable panels use the word device in the Selected group id parameter.
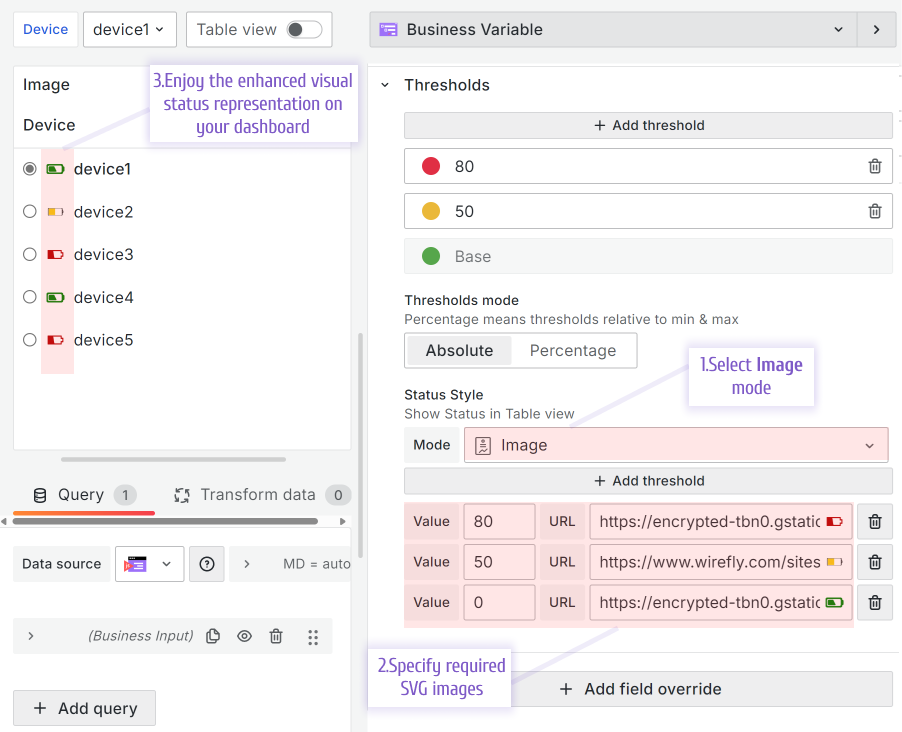
Custom image for the Grafana thresholds
Note
The Business Variable supports the Custom image feature starting from version 3.4.0.
Grafana thresholds provide better visual representation of data on your dashboard. You can enhance thresholds by specifying an SVG image instead of a simple colored circle:
Advanced: Select dependent variable to reset
Note
The Business Variable panel supports this feature starting from version 3.0.0.
The Select dependent variable to reset option is for advanced Business Variable panel users. This option bypasses some default Grafana functionality.
Grafana saves dashboard variable values for better performance and reuses them whenever possible. This is usually helpful, but in some scenarios, it doesn’t provide the best user experience.
To better understand this parameter, review the following concepts:
- dashboard variable
- dashboard variable query
- selected current value
- dashboard variable refresh/update
- dashboard variable reset
A [dashboard variable] is a set of values retrieved following rules set by a dashboard developer. For simplicity, we call these rules a dashboard variable query.
A dashboard variable can have a selected current value (or values).
A dashboard variable refresh/update occurs when the dashboard variable query runs to retrieve the full set of values. If a selected current value existed previously, Grafana assigns it again after the refresh/update.
Thus, a dashboard variable refresh/update has two steps.
The Select dependent variable to reset option tells Grafana to perform only the first step: rerun the dashboard variable query and skip the second step (don’t assign a selected current value).
The first step without the second step is called a dashboard variable reset.
The Select dependent variable to reset option links two dashboard variables and tells Grafana to reset one of them after you change the value of the first one.
The following two scenarios provide use cases for when dashboard variable reset is needed.
Scenario 1
In this scenario, two dashboard variables exist:
device, which uses the following query:
select name from device_time;type, which uses the following query that depends on the first variable:
select value from device_time where name='$device';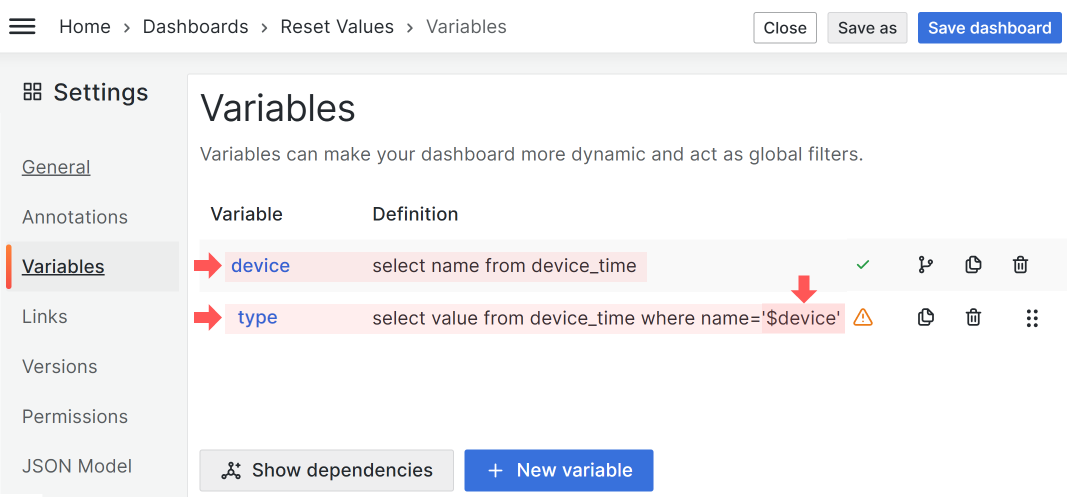
With this configuration, whenever you update the device variable (by selecting a value in the dashboard dropdown), the type variable automatically refreshes/updates. This means the query to populate the type variable runs with every device variable value update.
In the following example, some type variable values overlap:
- device 1, type in ('1', '2', '3')
- device 2, type in ('2', '3')
- device 3, type in ('3')
The value ‘3’ is common for all devices. The value ‘2’ is shared by device 1 and device 2. The value ‘1’ is unique to the first device.
If you set type to ‘3’, then when you switch devices in the device variable, you always see ‘3’ in the type variable. The type variable refreshes/updates (the underlying query reruns), and then Grafana sets it to ‘3’ (the previously selected value).
If you set type to 1 (a non-overlapping value unique to one device), then when you switch the device variable, the type refreshes/updates (the underlying query reruns) and the first retrieved value appears. Grafana can’t set the previously selected value because that value doesn’t exist for device 2 and device 3.
The Select dependent variable to reset parameter ensures that overlapping values don’t matter.
The variable name you specify in Select dependent variable to reset always resets, and the displayed value comes from the first retrieved value, not from previous selections.
Scenario 2
Variables don’t have to depend on each other. In this scenario, the type variable has the Custom type. Values are specified directly, separated by commas.
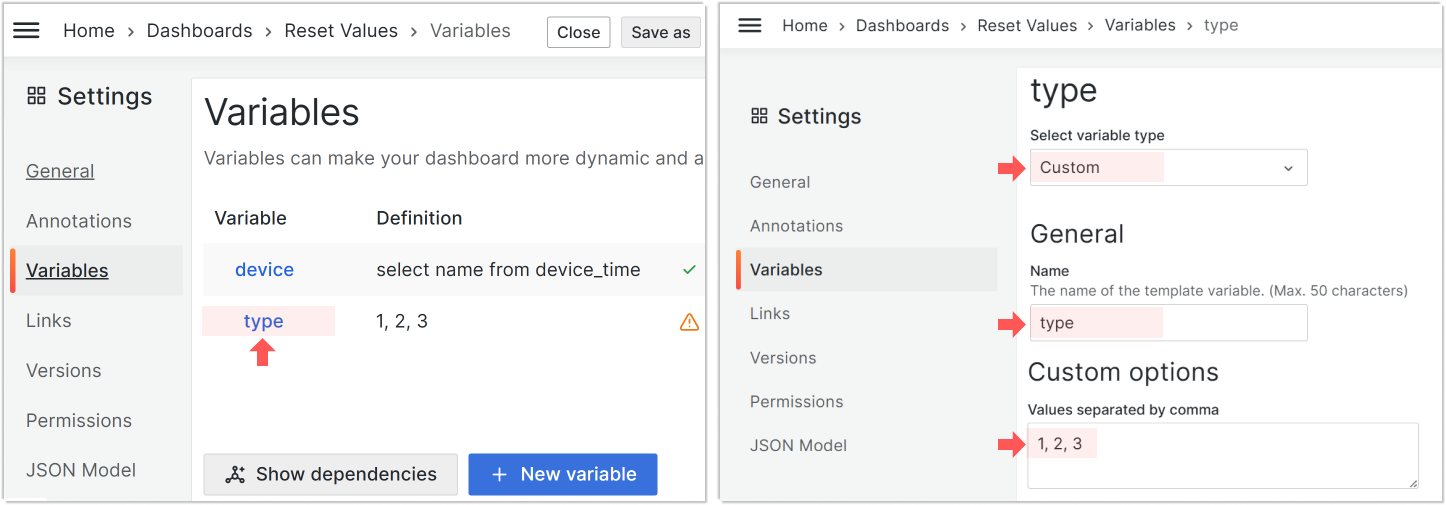
With the Custom dashboard variable type, the two dashboard variables aren’t linked and act independently. This means refreshing/updating the device variable doesn’t affect the type variable.
In this scenario, using the Select dependent variable to reset parameter is the only way to trigger the type variable reset when the device variable refreshes/updates.


