Menu
Grafana Cloud
Enterprise
Open source
Data flow
This page explains how the Business Variable panel processes data.
A visualization panel versus the Business Variable panel
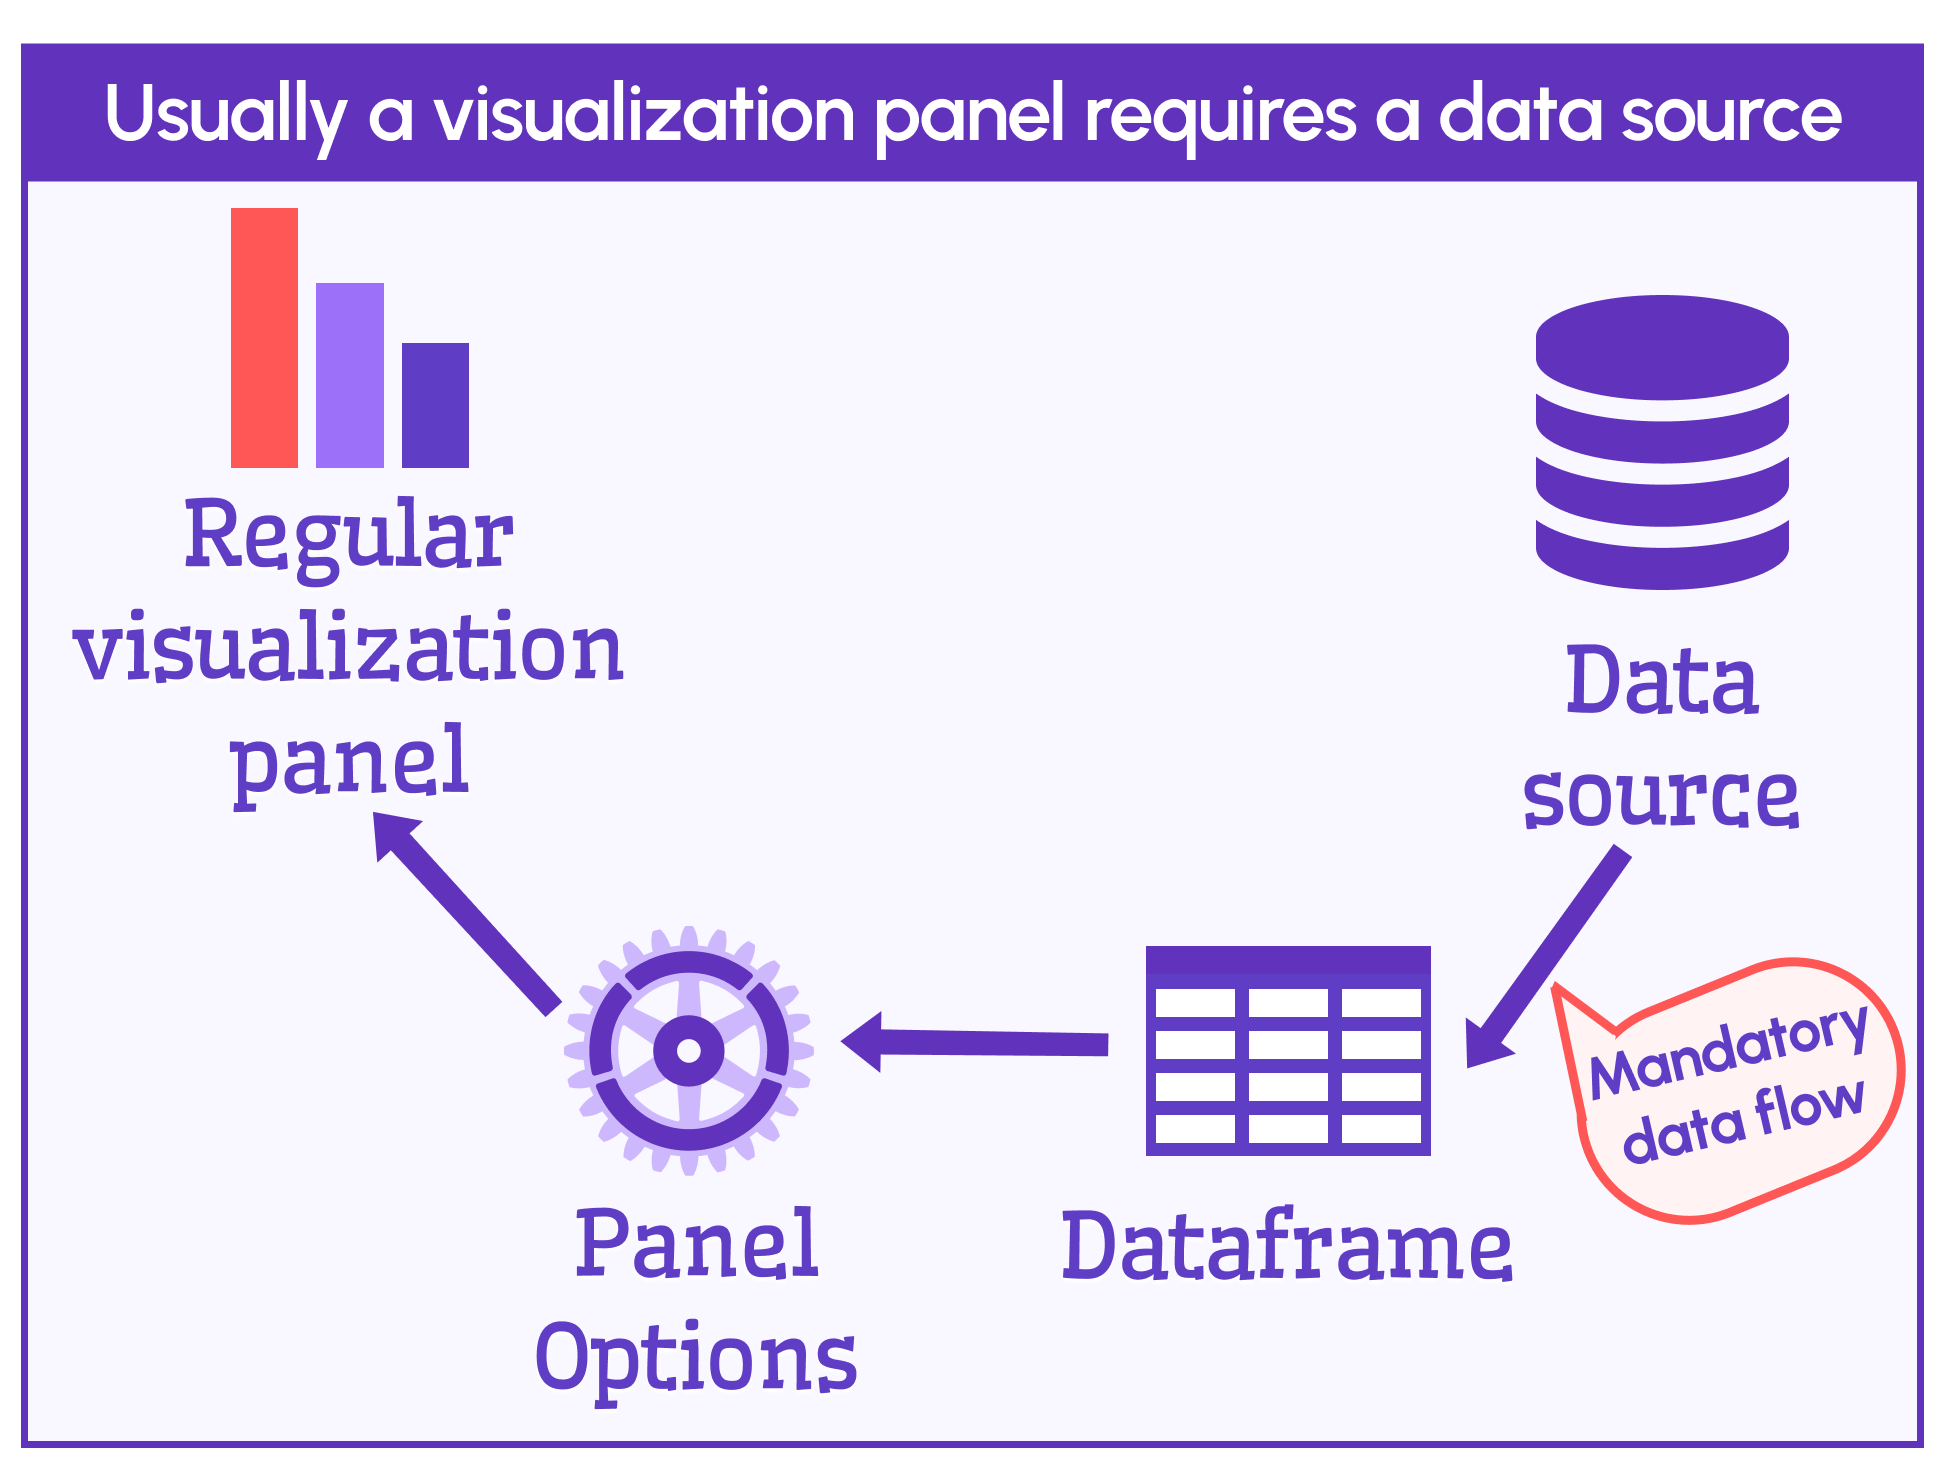
The following two schemas compare data flow in different panel types. The first schema shows the data flow for a regular Grafana visualization panel. Typically, a panel requires a data source to fetch data for display.
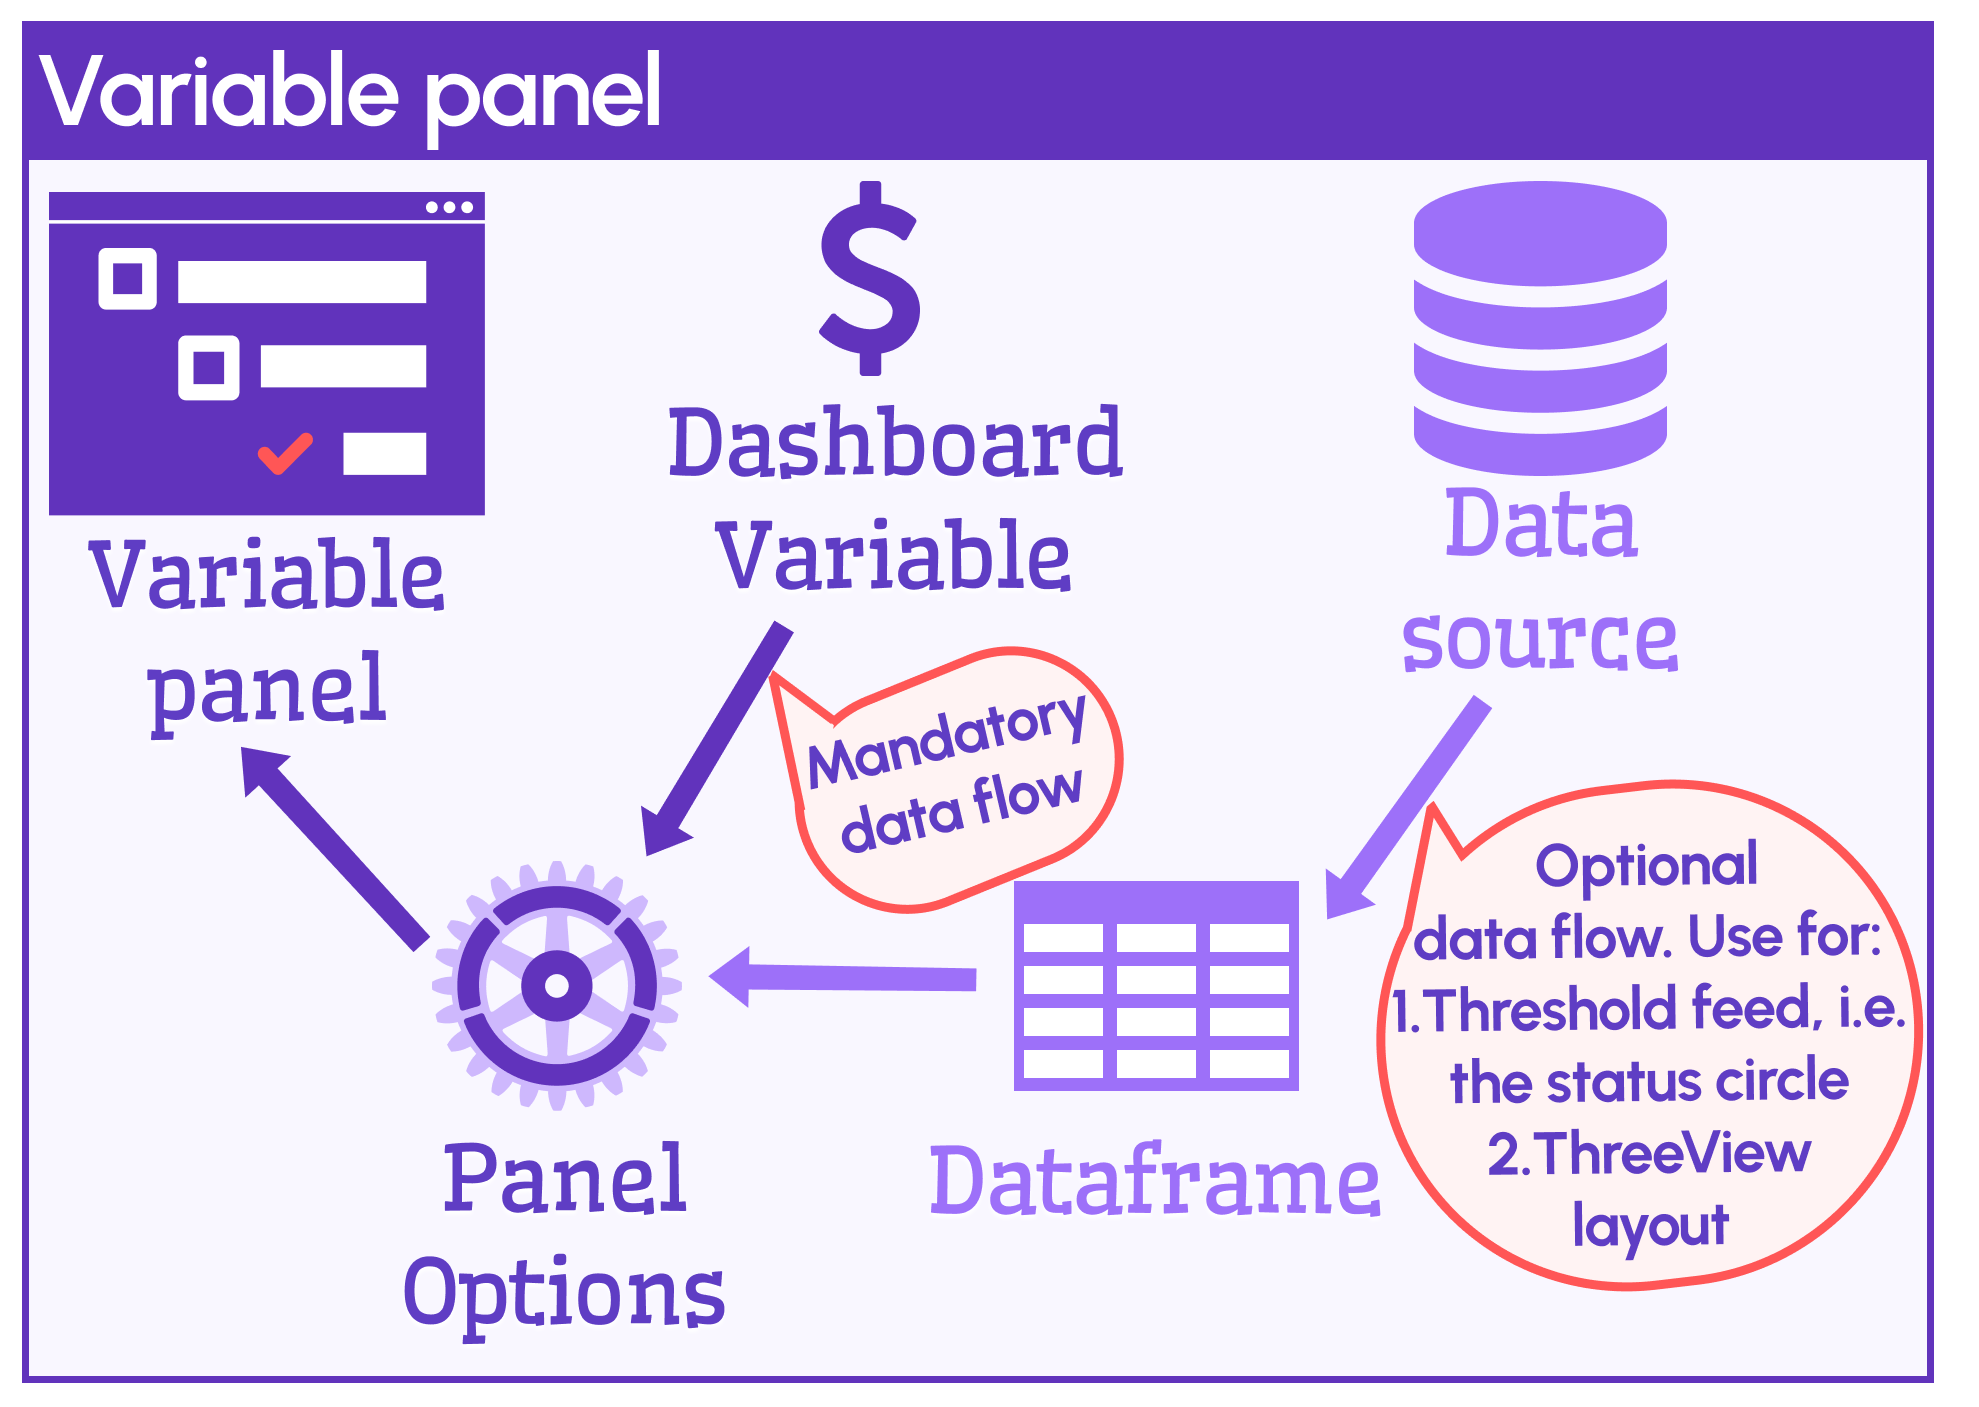
The Business Variable panel doesn’t require a data source. The panel works with your dashboard variable, which is already a set of values. The Business Variable panel uses your dashboard variable as a data source.
You can optionally use a data source for two purposes:
- To display a color status next to your variable, provide a numeric value to evaluate using thresholds.
- To create a TreeView format, provide node relations through the connected data source.