
Menu
Grafana Cloud
Enterprise
Open source
Streaming
Streaming allows real-time data updates using streaming data sources and Grafana Live.
Grafana Live
Grafana Live is a real-time messaging engine introduced in Grafana v8.0. With Grafana Live, you can push event data to the application frontend upon an event occurrence.
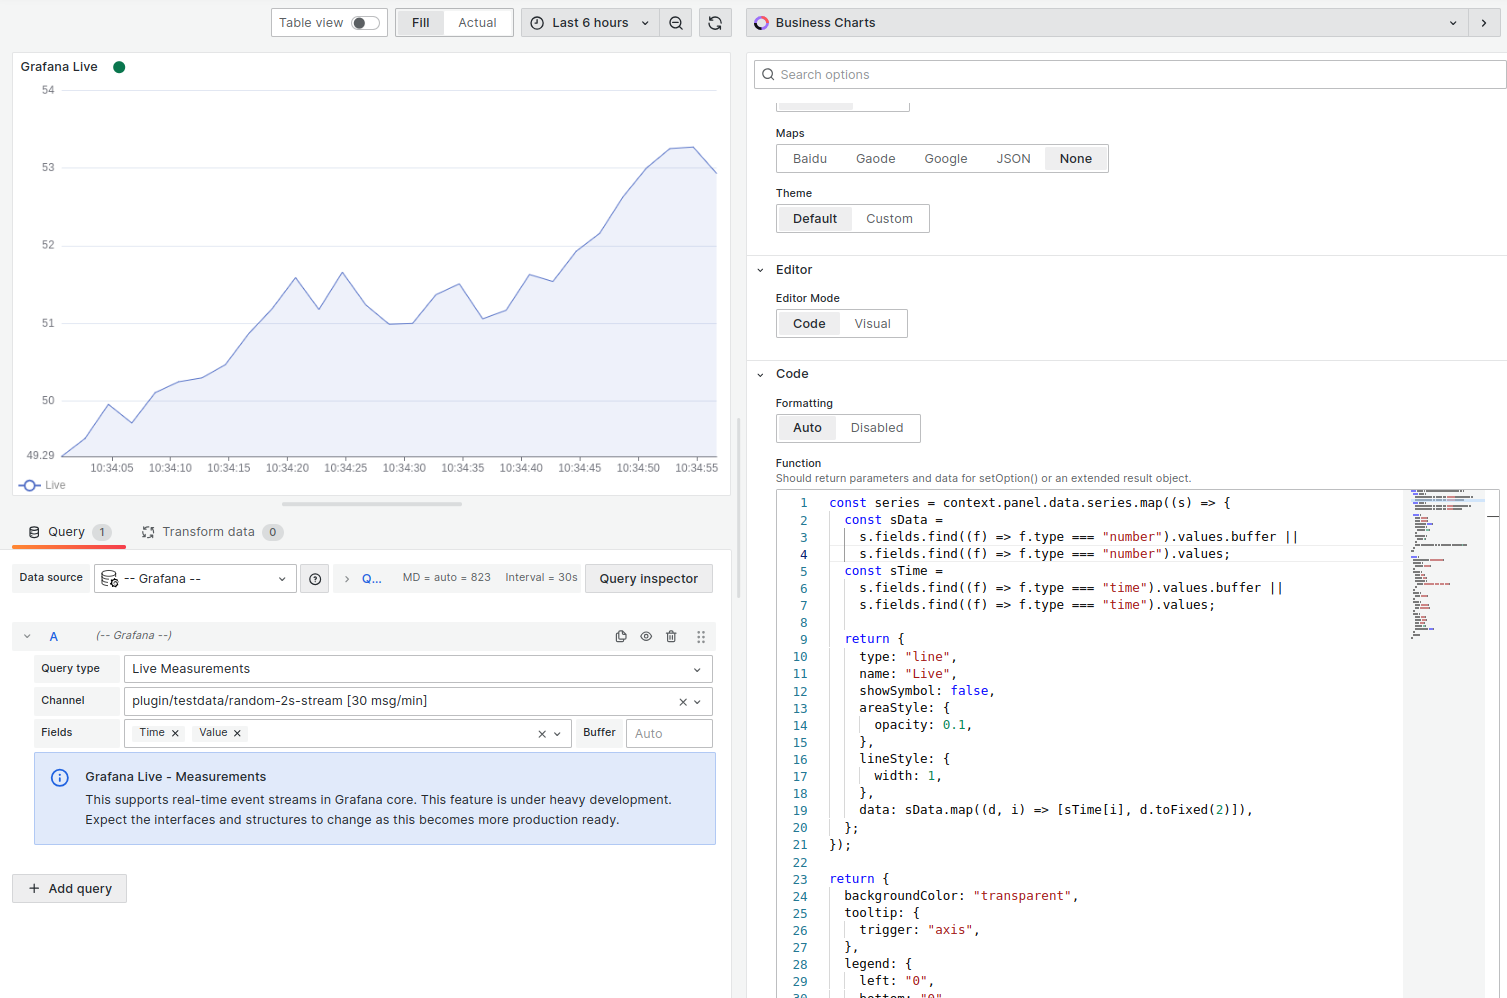
Example
const series = context.panel.data.series.map((s) => {
const sData = s.fields.find((f) => f.type === "number").values;
const sTime = s.fields.find((f) => f.type === "time").values;
return {
type: "line",
name: "Live",
showSymbol: false,
areaStyle: {
opacity: 0.1,
},
lineStyle: {
width: 1,
},
data: sData.map((d, i) => [sTime[i], d.toFixed(2)]),
};
});
return {
backgroundColor: "transparent",
tooltip: {
trigger: "axis",
},
legend: {
left: "0",
bottom: "0",
textStyle: {
color: "rgba(128, 128, 128, .9)",
},
},
xAxis: {
type: "time",
},
yAxis: {
type: "value",
min: "dataMin",
},
grid: {
left: "2%",
right: "2%",
top: "2%",
bottom: 24,
containLabel: true,
},
series,
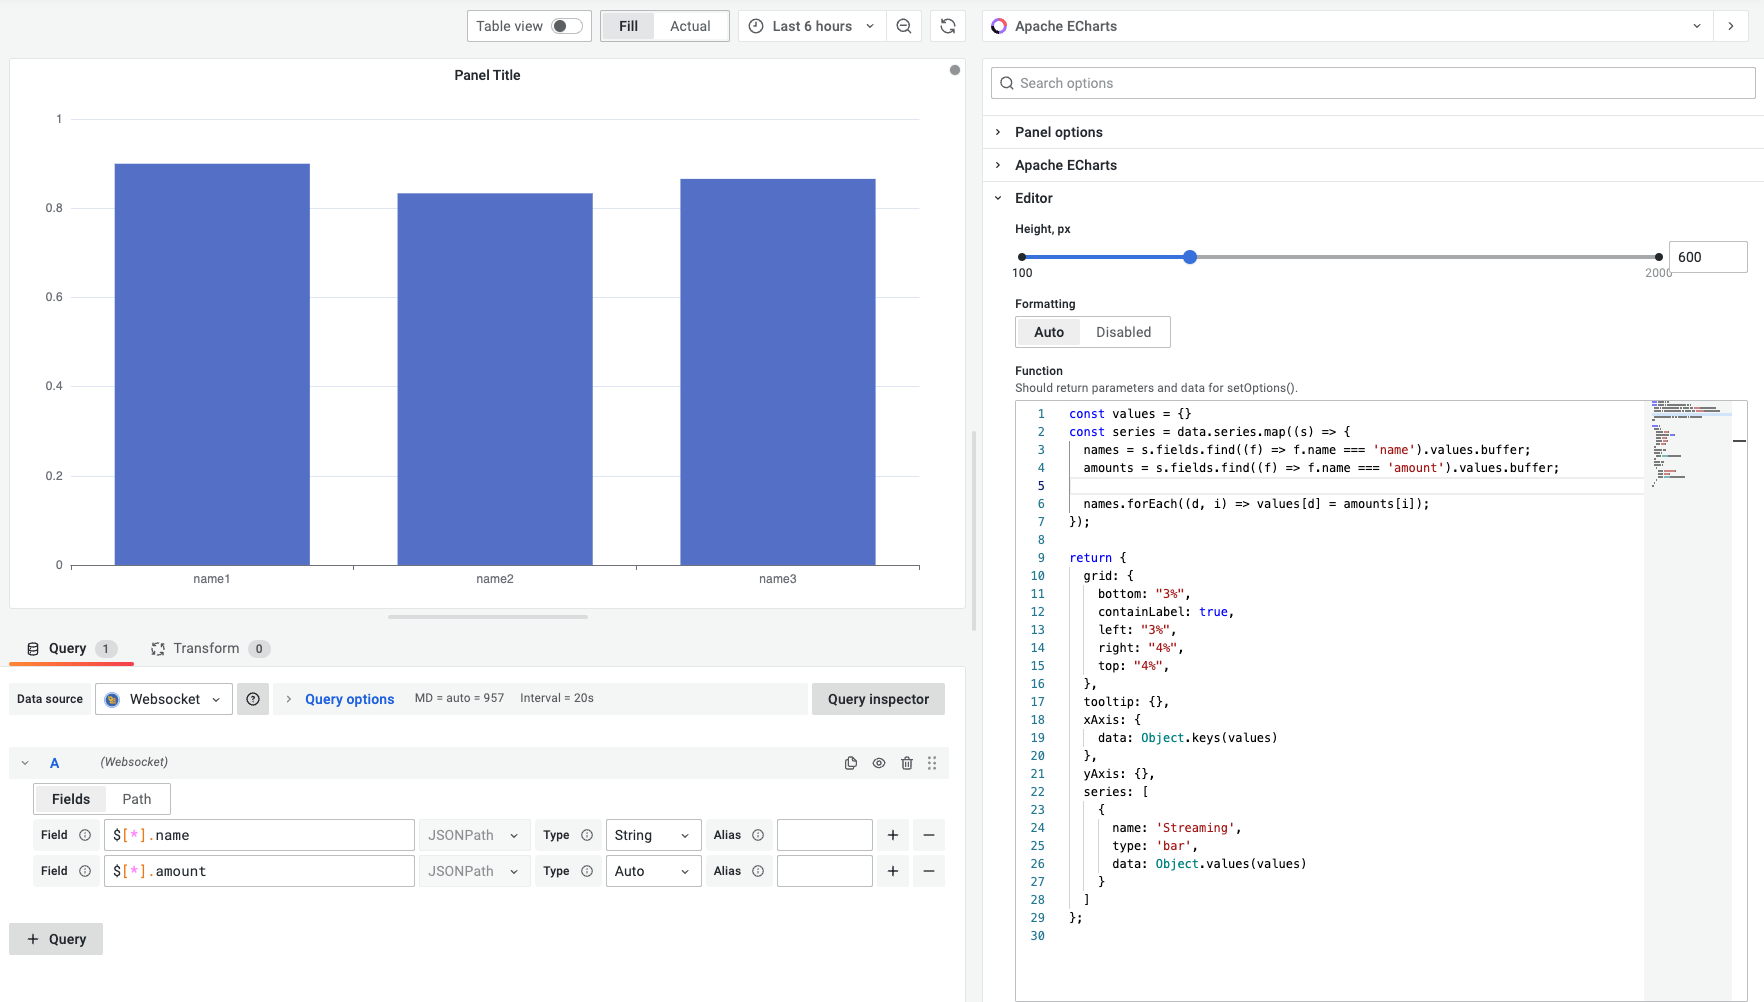
};WebSocket API
To stream real-time data, the WebSocket Data Source for Grafana was used.
Server
Example of Node.js WebSocket Server implementation.
const ws = require("ws");

/**
 * Server
 */
const server = new ws.WebSocketServer({ port: 8080 });

/**
 * Send Data
 */
const sendData = (socket) => {
  const json = [
    { name: "name1", amount: Math.random() },
    { name: "name2", amount: Math.random() },
    { name: "name3", amount: Math.random() },
  ];

  socket.send(JSON.stringify(json));

  setTimeout(() => {
    sendData(socket);
  }, 1000);
};

/**
 * Connection
 */
server.on("connection", (socket) => {
  console.log("Connected...");

  setTimeout(() => {
    sendData(socket);
  }, 1000);
});
Provisioning
WebSocket API Data Source can be provisioned using configuration files or in Grafana UI.
apiVersion: 1

datasources:
  - name: Websocket
    type: golioth-websocket-datasource
    uid: LWj8ert4k
    access: proxy
    orgId: 1
    version: 1
    editable: true
    jsonData:
      host: ws://WebSocker-Server:8080
Example
const values = {};
const series = context.panel.data.series.map((s) => {
  names = s.fields.find((f) => f.name === "name").values;
  amounts = s.fields.find((f) => f.name === "amount").values;

  names.forEach((d, i) => (values[d] = amounts[i]));
});

return {
  grid: {
    bottom: "3%",
    containLabel: true,
    left: "3%",
    right: "4%",
    top: "4%",
  },
  animation: false,
  tooltip: {},
  xAxis: {
    data: Object.keys(values),
  },
  yAxis: {},
  series: [
    {
      name: "Streaming",
      type: "bar",
      data: Object.values(values),
    },
  ],
};
Gauge
Another example of displaying Grafana live data using Gauge.
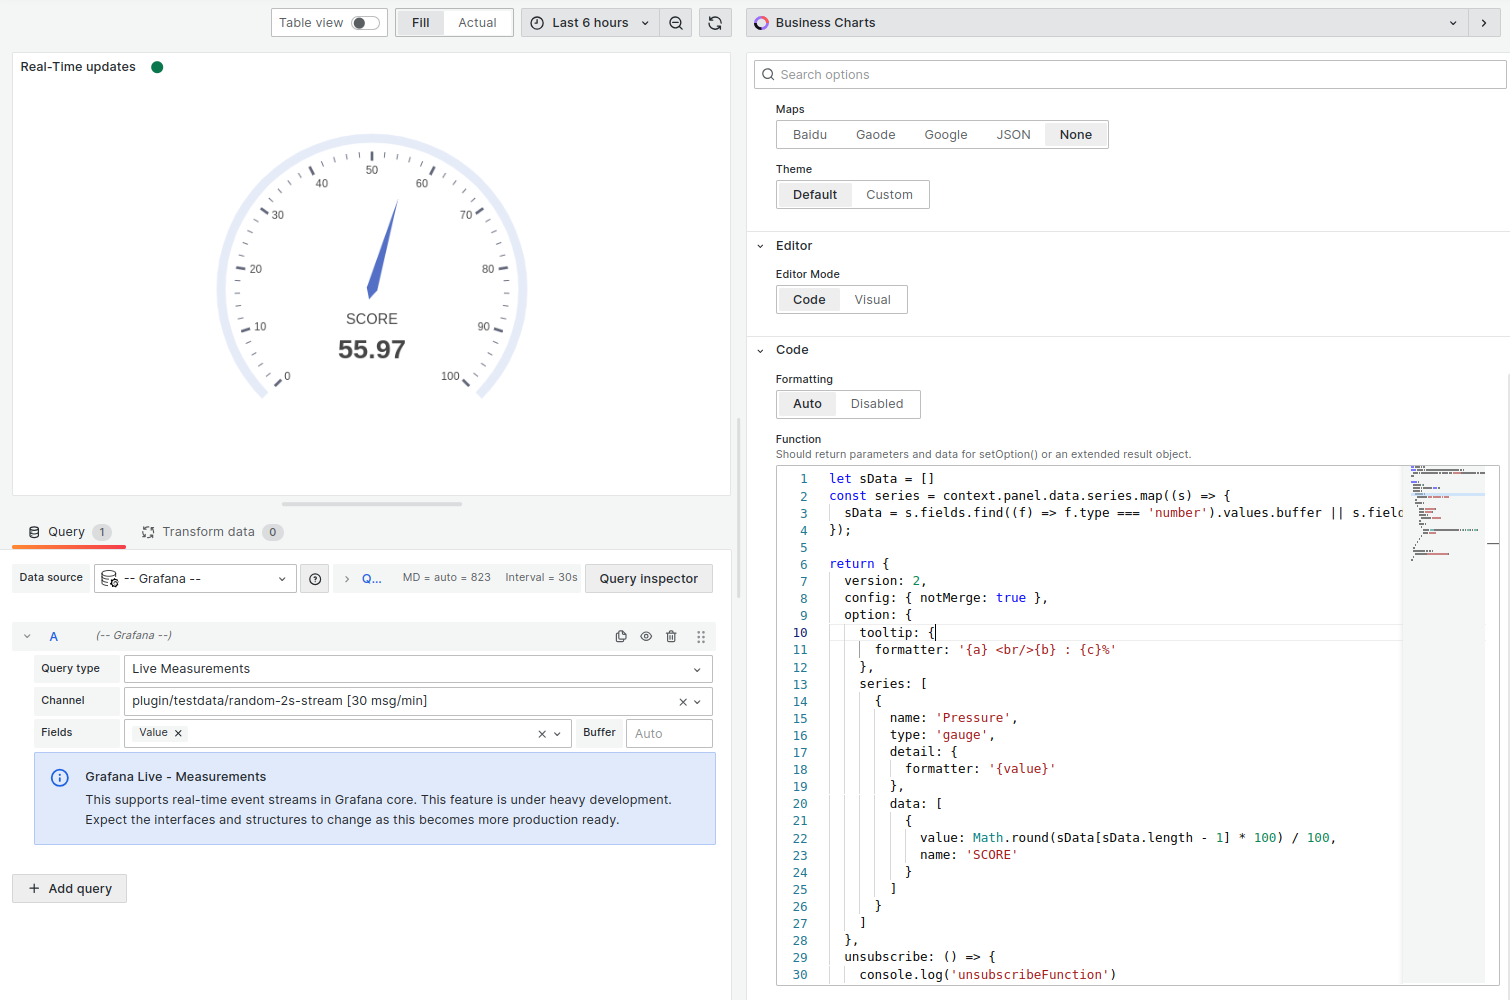
Example
let sData = [];
const series = context.panel.data.series.map((s) => {
  sData = s.fields.find((f) => f.type === "number").values;
});

return {
  version: 2,
  config: { notMerge: true },
  option: {
    tooltip: {
      formatter: "{a} <br/>{b} : {c}%",
    },
    series: [
      {
        name: "Pressure",
        type: "gauge",
        detail: {
          formatter: "{value}",
        },
        data: [
          {
            value: Math.round(sData[sData.length - 1] * 100) / 100,
            name: "SCORE",
          },
        ],
      },
    ],
  },
  unsubscribe: () => {
    console.log("unsubscribeFunction");
  },
};

