Menu
Grafana Cloud
Enterprise
Open source
Raster and vector images
This guide explains how to use images in the Business Charts panel, depending on the source type.
The Business Charts panel supports base64 PNG and SVG (vector) images
Use Cases
As mentioned in the video tutorial, the typical cases when you may need to use images include:
- Data points
- Simple labels
- Loaded labels
- Tooltips
- Axis labels
- Axis data labels
- Legend
- Background
You can enhance all of the mentioned visual components with your images. You can use several ways to reference images in the plugin configuration.
Reference images
- URL: using the
image://prefix. - Path: using the
path://prefix. - XML file: using the
image://data:image/svg+xml;utf8prefix. - PNG(raster) image: using the
image://data:image;base64prefix.
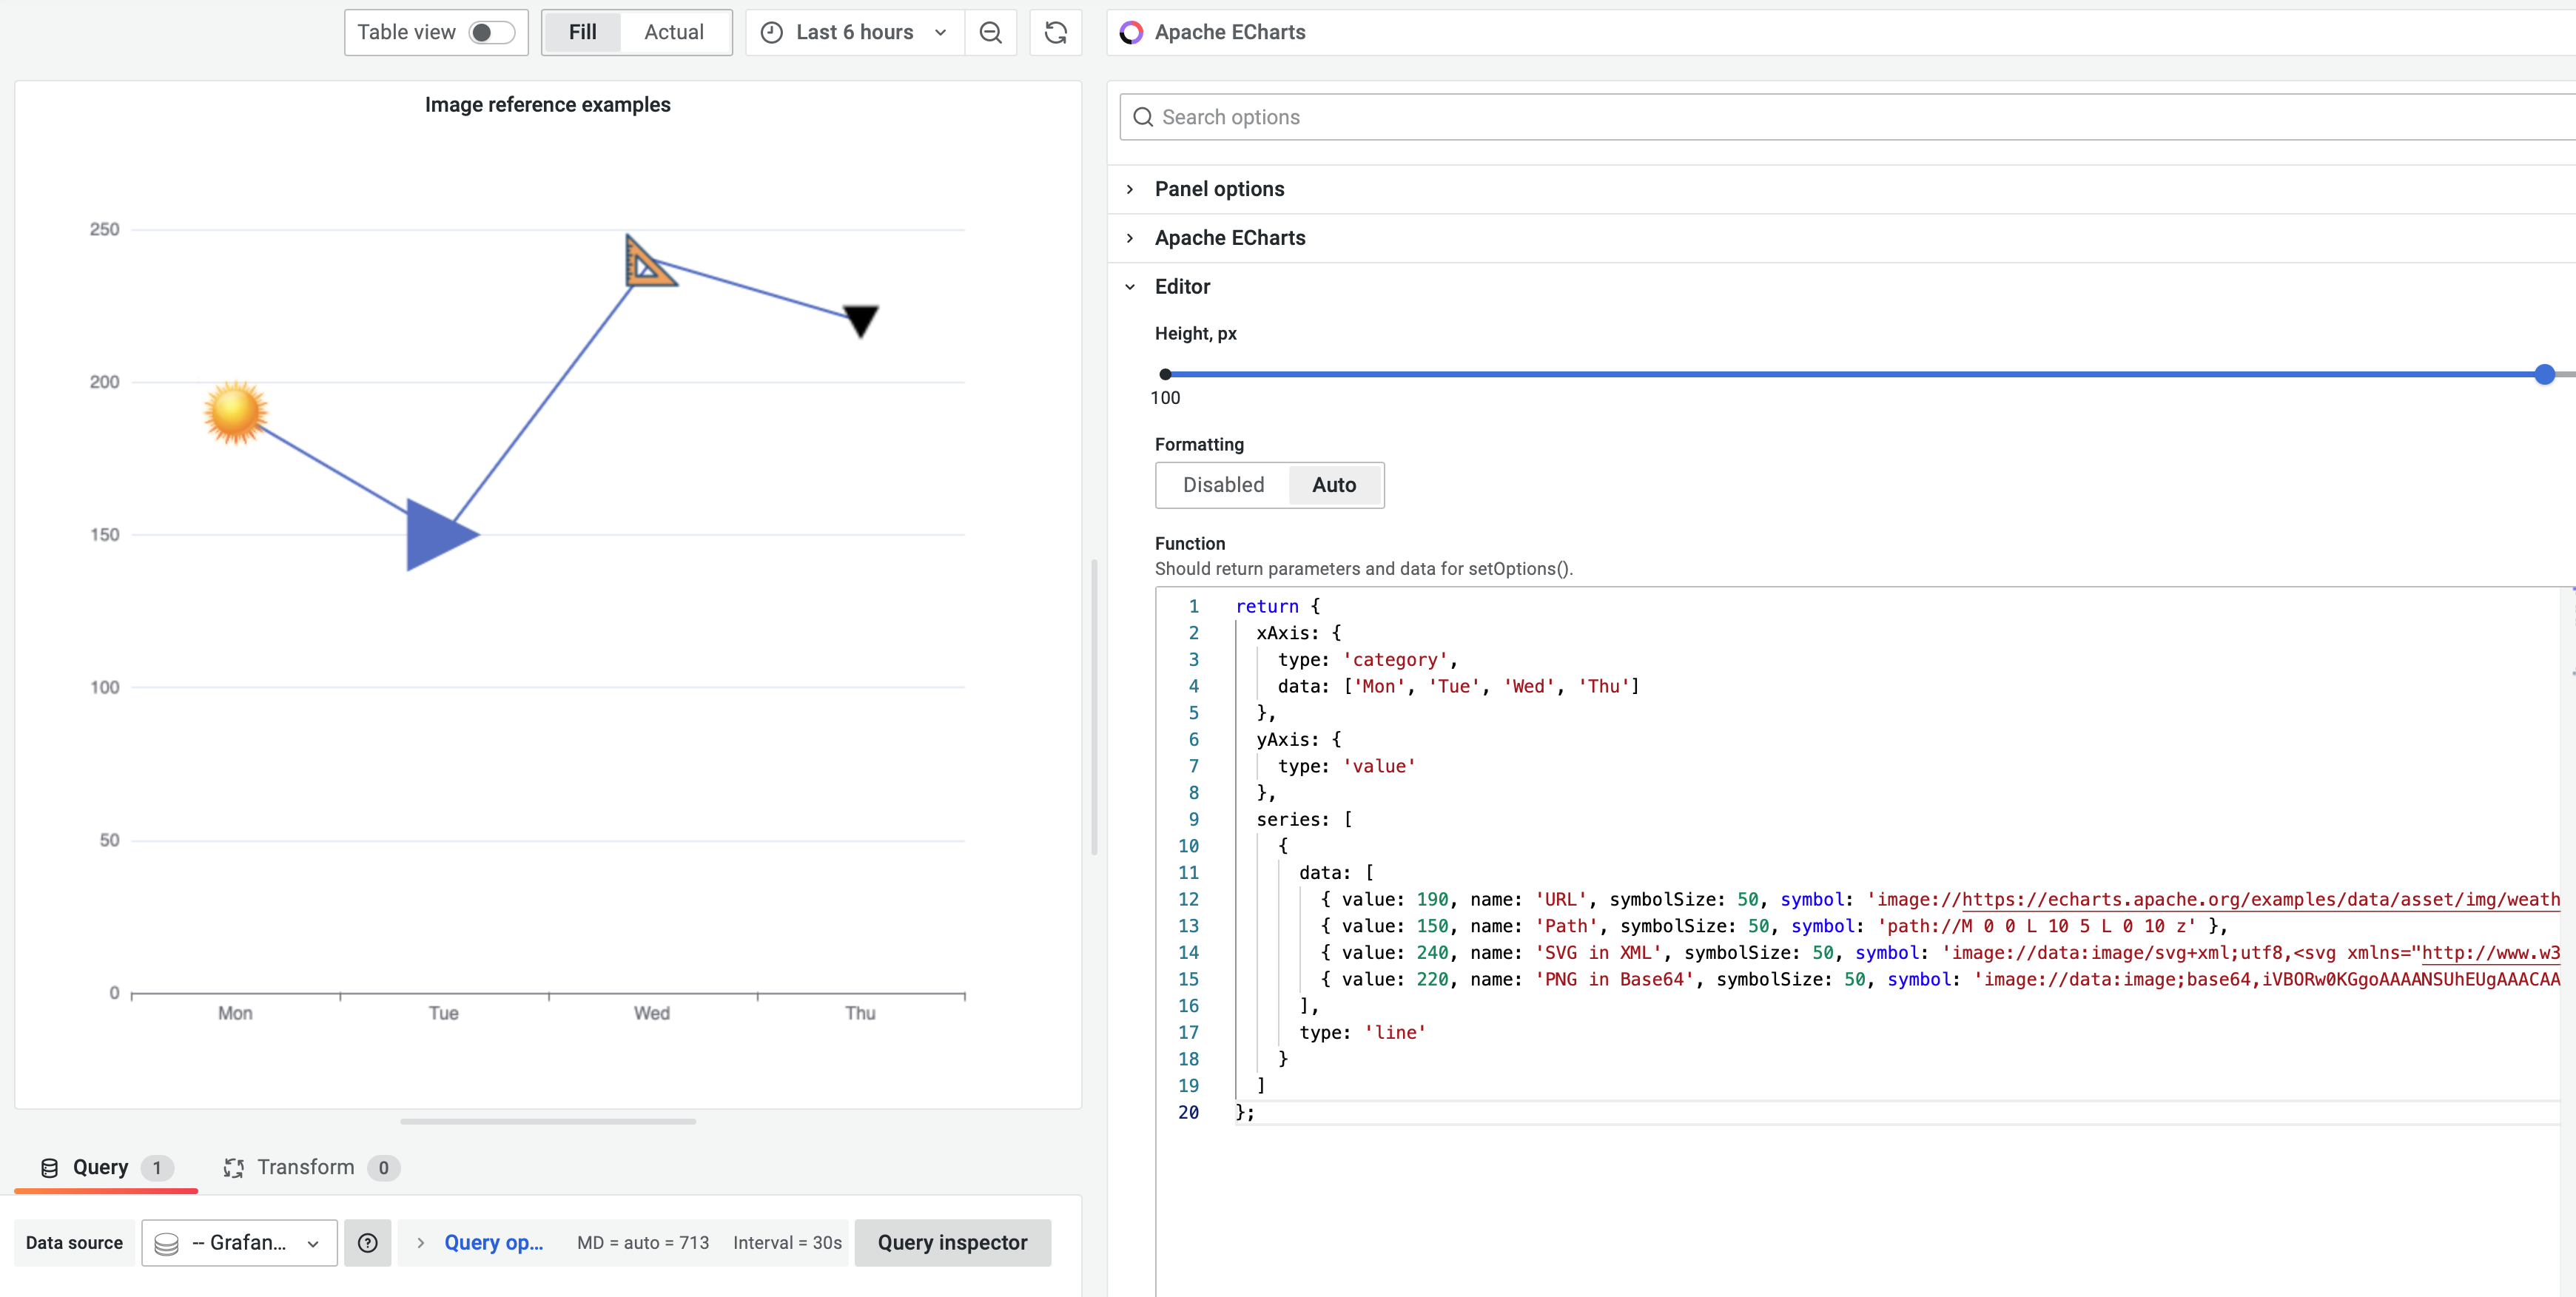
Example
You can copy the following code and run it in your instance of the Business Charts panel on your Grafana dashboard.
return {
  xAxis: {
    type: "category",
    data: ["Mon", "Tue", "Wed", "Thu"],
  },
  yAxis: {
    type: "value",
  },
  series: [
    {
      data: [
        {
          value: 190,
          name: "URL",
          symbolSize: 50,
          symbol:
            "image://https://echarts.apache.org/examples/data/asset/img/weather/sunny_128.png",
        },
        {
          value: 150,
          name: "Path",
          symbolSize: 50,
          symbol: "path://M 0 0 L 10 5 L 0 10 z",
        },
        {
          value: 240,
          name: "SVG in XML",
          symbolSize: 50,
          symbol:
            'image://data:image/svg+xml;utf8,<svg xmlns="http://www.w3.org/2000/svg" viewBox="0 0 32 32"><path fill="%23f09f53" d="M4.996 4.996v22.008h22.008L4.996 4.996zm4 9 9.008 9.008H8.996v-9.008z"/><path fill="%231a4875" d="M27.357 26.65 5.35 4.643a.5.5 0 0 0-.854.353v22.008a.5.5 0 0 0 .5.5h22.008a.5.5 0 0 0 .353-.854zm-21.861-.146v-2h.5a.5.5 0 0 0 0-1h-.5v-1h1.5a.5.5 0 0 0 0-1h-1.5v-1h.5a.5.5 0 0 0 0-1h-.5v-1h1.5a.5.5 0 0 0 0-1h-1.5v-1h.5a.5.5 0 0 0 0-1h-.5v-1h1.5a.5.5 0 0 0 0-1h-1.5v-1h.5a.5.5 0 0 0 0-1h-.5v-1h1.5a.5.5 0 0 0 0-1h-1.5V6.203l20.301 20.301H5.496z"/><path fill="%231a4875" d="M8.996 23.504h9.008a.5.5 0 0 0 .354-.854L9.35 13.643a.5.5 0 0 0-.854.354v9.008a.5.5 0 0 0 .5.499zm.5-8.301 7.301 7.301H9.496v-7.301z"/></svg>',
        },
        {
          value: 220,
          name: "PNG in Base64",
          symbolSize: 50,
          symbol:
            "image://data:image;base64,iVBORw0KGgoAAAANSUhEUgAAACAAAAAgCAYAAABzenr0AAAACXBIWXMAAAsTAAALEwEAmpwYAAAAlUlEQVRYw2NgGAWjYBSMgiEAooE4jUwcTQ0H1APxfzJxPTUcwA3ET8mw/ClUL1VAMhkOSKZmOmAG4kskWH4JqoeqwJ0EB7jTKkfsIMLyHbTMkrpA/AeP5X+gamgK5uBxwBx6FEySQPwFi+VfoHJ0AfW0KnTILZyoWuiQUzglMwwAgBVONCl0SCmc3BlGwSgYBaOAAgAAeotyvZwCFhMAAAAASUVORK5CYII=",
        },
      ],
      type: "line",
    },
  ],
};
You should see the following visualization.