
Menu
Grafana Cloud
Enterprise
Open source
Annotations
Annotations is a general term for several Grafana artifacts:
- Native annotations
- Alerts
- Annotation queries
The differences between annotation types are explained in the how-to tutorial in the Grafana Crash Course.
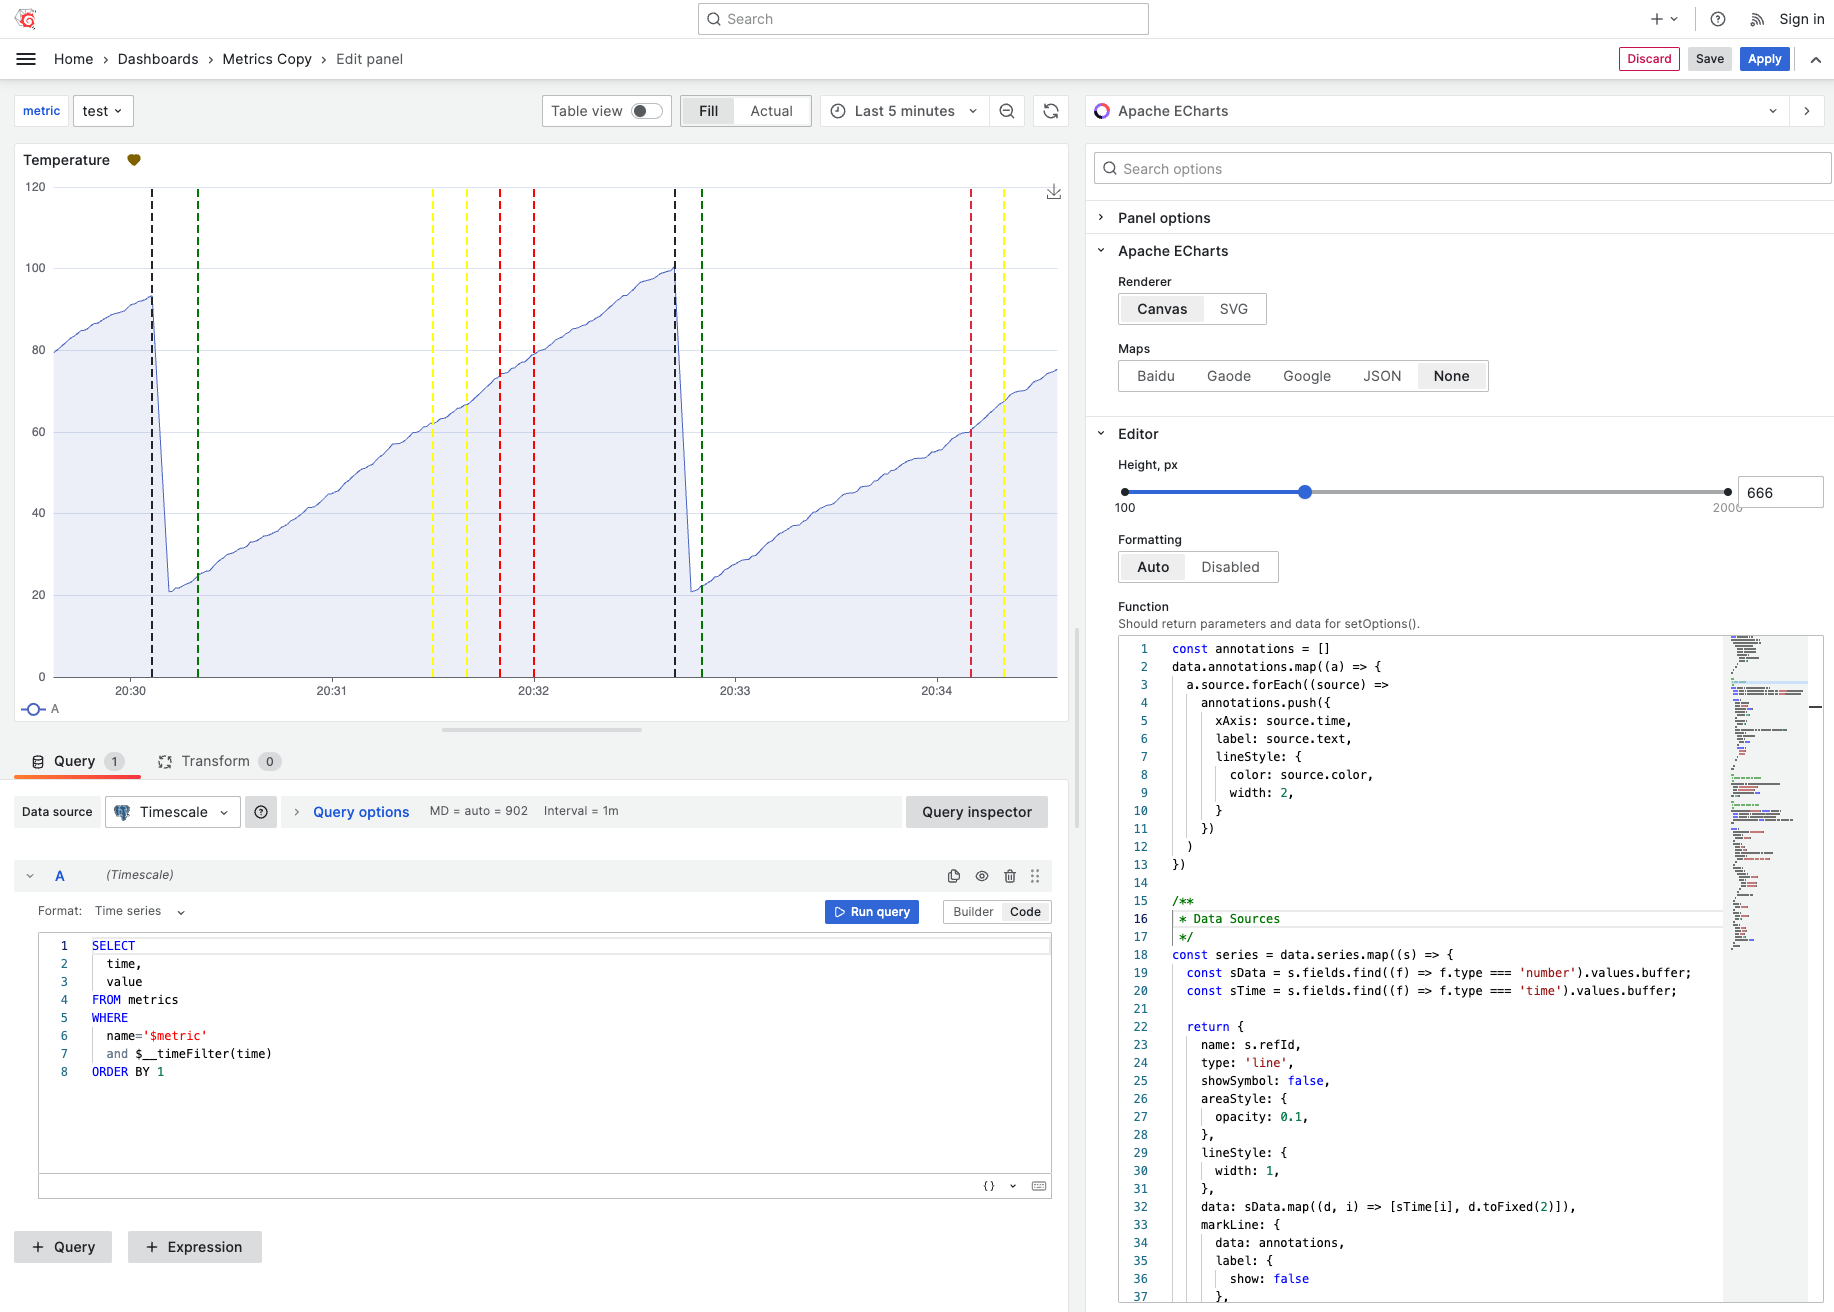
Mark lines
The Business Charts panel displays annotations with mark lines. Data for mark lines comes from the context.panel.data.annotations object.
Example
const annotations = [];
context.panel.data.annotations.map((a) => {
  a.source.forEach((source) =>
    annotations.push({
      xAxis: source.time,
      label: source.text,
      lineStyle: {
        color: source.color,
        width: 2,
      },
    })
  );
});

/**
 * Data Sources
 */
const series = context.panel.data.series.map((s) => {
  const sData = s.fields.find((f) => f.type === "number").values;
  const sTime = s.fields.find((f) => f.type === "time").values;

  return {
    name: s.refId,
    type: "line",
    showSymbol: false,
    areaStyle: {
      opacity: 0.1,
    },
    lineStyle: {
      width: 1,
    },
    data: sData.map((d, i) => [sTime[i], d.toFixed(2)]),
    markLine: {
      data: annotations,
      label: {
        show: false,
      },
      symbol: ["none", "none"],
    },
  };
});

/**
 * Enable Data Zoom by default
 */
setTimeout(
  () =>
    context.panel.chart.dispatchAction({
      type: "takeGlobalCursor",
      key: "dataZoomSelect",
      dataZoomSelectActive: true,
    }),
  500
);

/**
 * Update Time Range on Zoom
 */
context.panel.chart.on("datazoom", function (params) {
  const startValue = params.batch[0]?.startValue;
  const endValue = params.batch[0]?.endValue;
  context.grafana.locationService.partial({ from: startValue, to: endValue });
});

/**
 * Options
 */
return {
  backgroundColor: "transparent",
  tooltip: {
    trigger: "axis",
  },
  legend: {
    left: "0",
    bottom: "0",
    data: context.panel.data.series.map((s) => s.refId),
    textStyle: {
      color: "rgba(128, 128, 128, .9)",
    },
  },
  toolbox: {
    feature: {
      dataZoom: {
        yAxisIndex: "none",
        icon: {
          zoom: "path://",
          back: "path://",
        },
      },
      saveAsImage: {},
    },
  },
  xAxis: {
    type: "time",
  },
  yAxis: {
    type: "value",
    min: 0,
  },
  grid: {
    left: "1%",
    right: "1%",
    top: "2%",
    bottom: 24,
    containLabel: true,
  },
  series,
};

