Menu
Grafana Cloud
Enterprise
Open source
Business Charts
You can use the Business Input data source to test the Business Charts panel. The following examples show how to create values:
- Manually
- By using the JavaScript Values Editor
Both examples use the Business Charts Visual Editor to read the data frame values and pass them to the Business Charts.
Note
You can use the Business Charts demo project to play with both the Business Input data source settings and the Business Charts parameters following the link Business Charts Pie examples. Go to Edit mode and start experimenting.
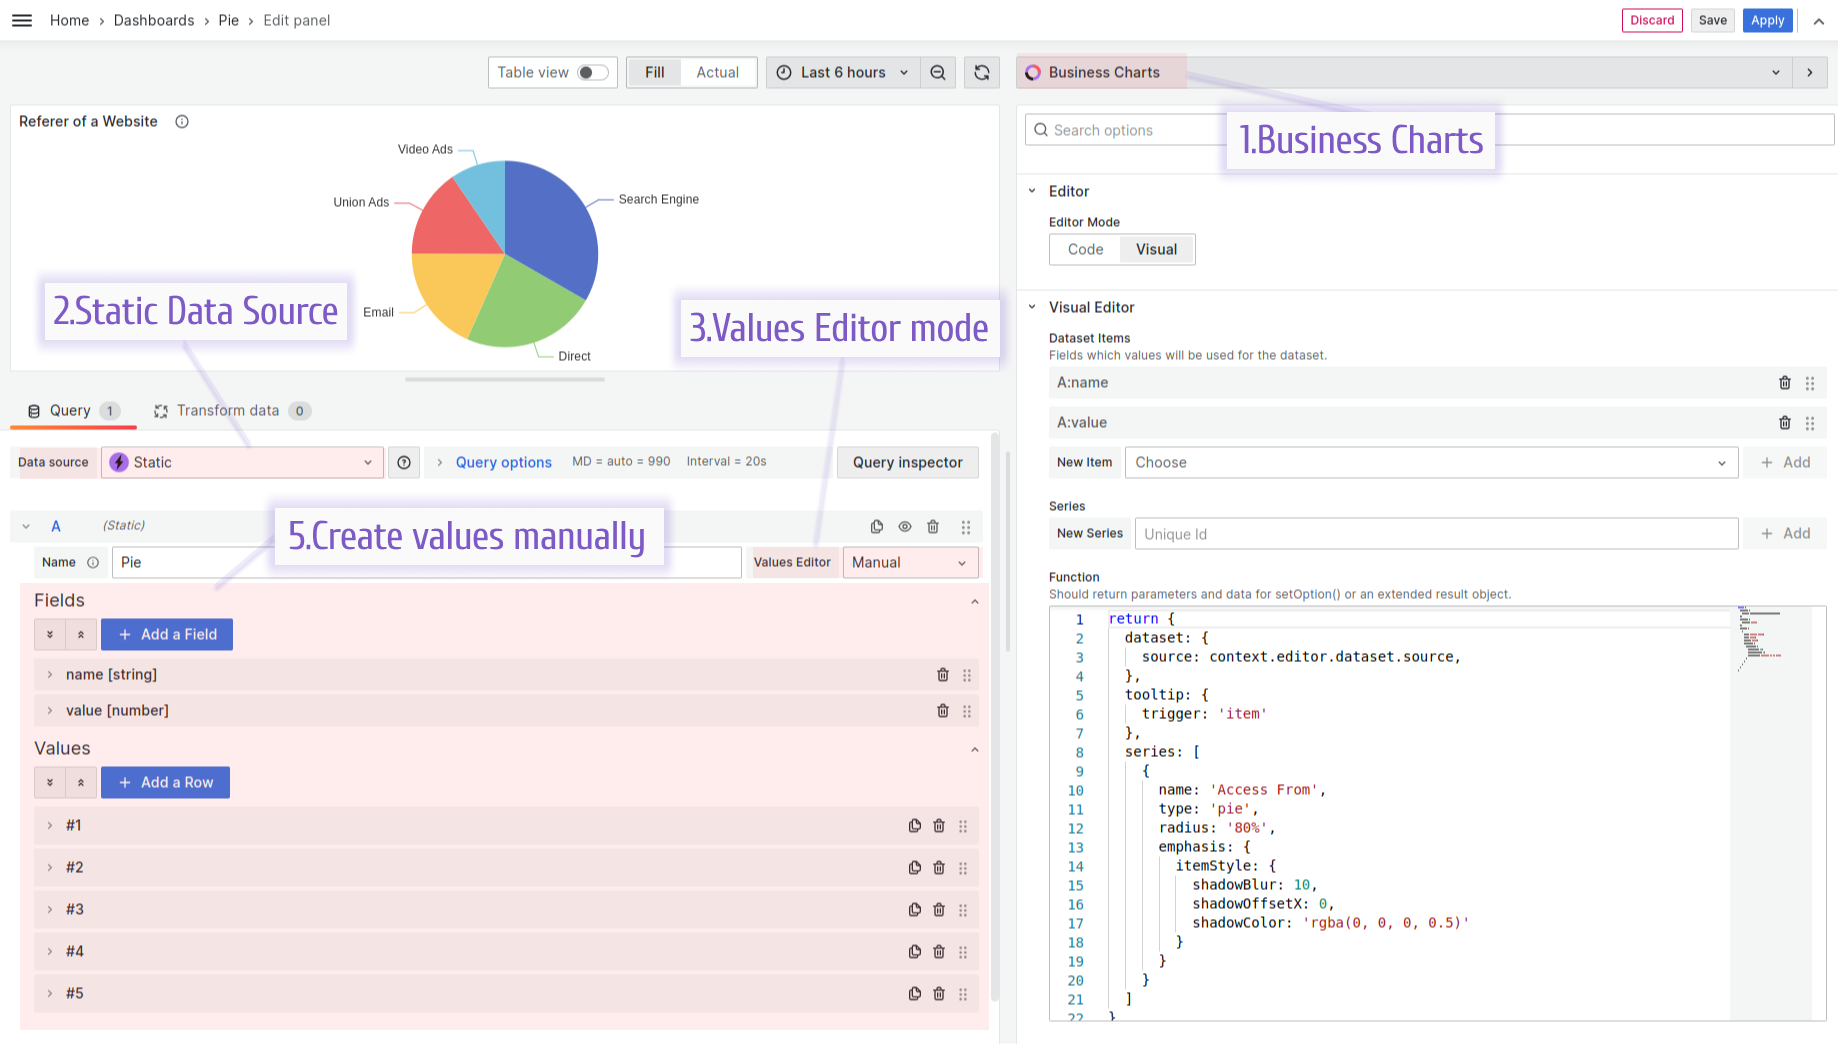
Manual
You can use the Business Input data source to add files and values manually.
JavaScript Values Editor
You can use the JavaScript Values Editor to generate data frame values.
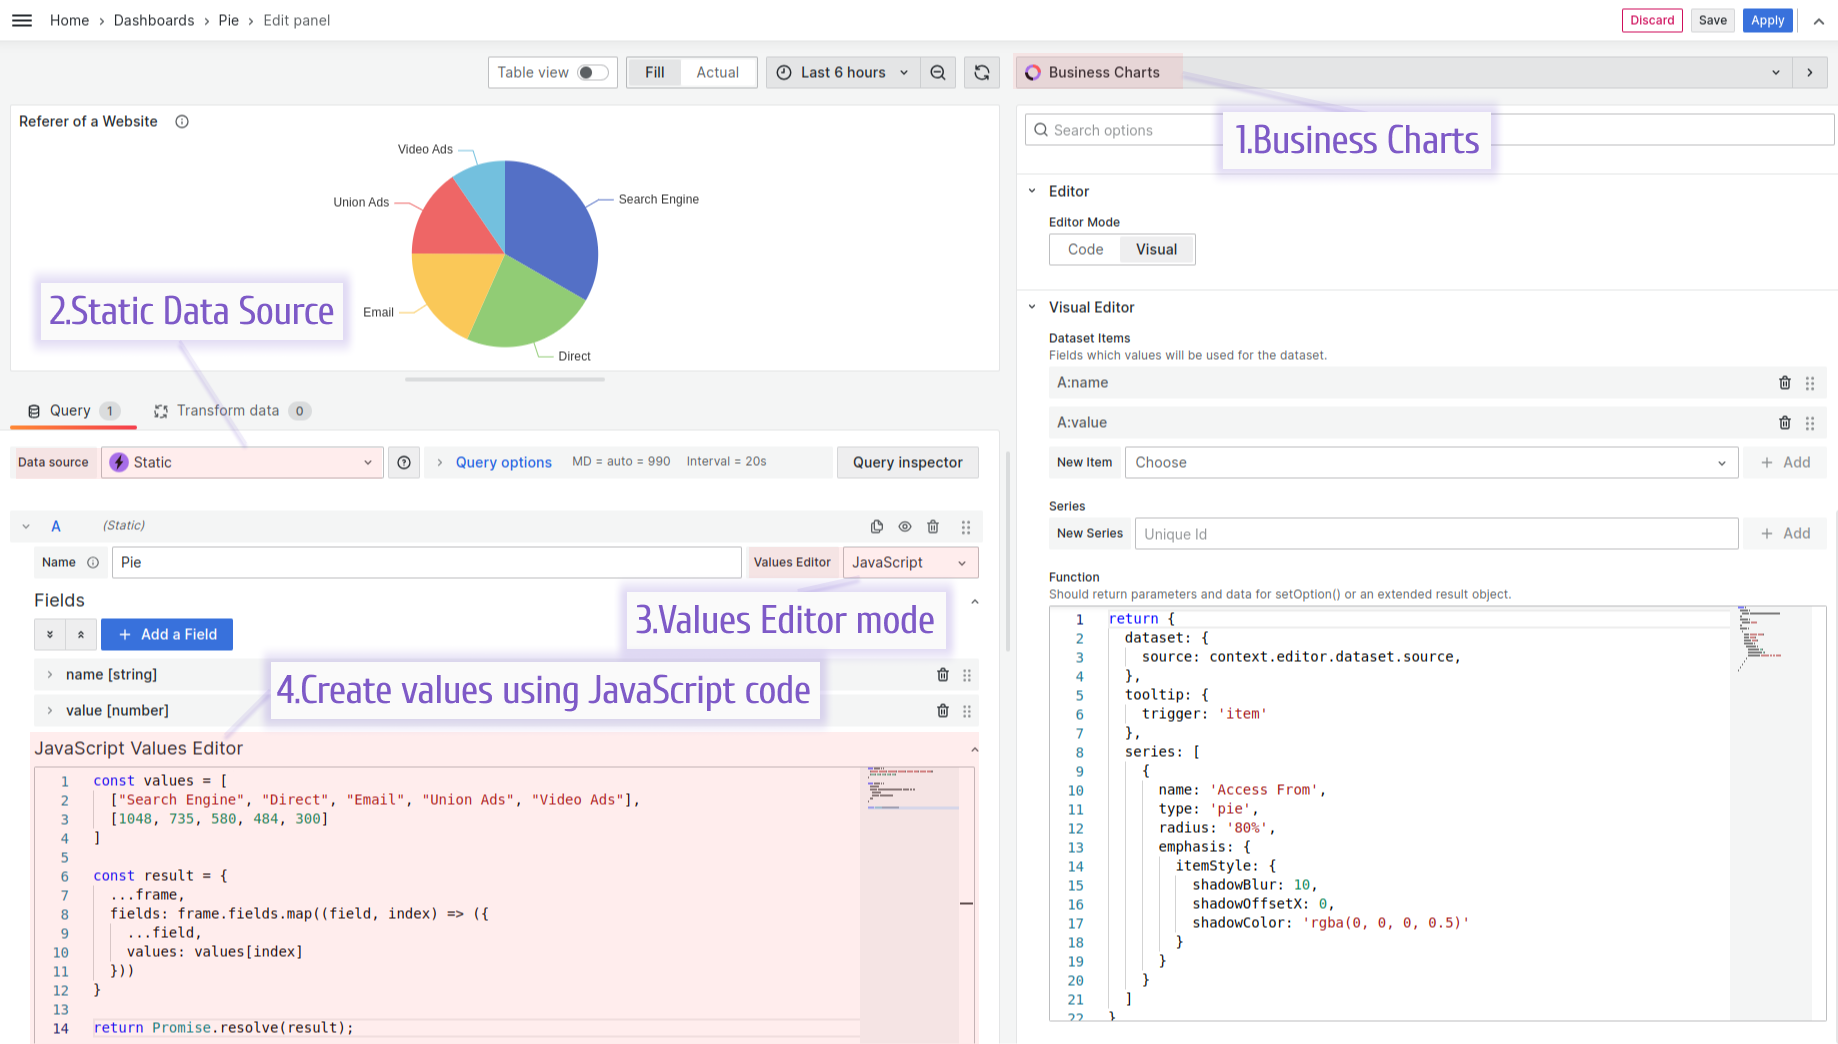
The following JavaScript code creates values for the Business Input data source:
const values = [
  ["Search Engine", "Direct", "Email", "Union Ads", "Video Ads"],
  [1048, 735, 580, 484, 300],
];

const result = {
  ...frame,
  fields: frame.fields.map((field, index) => ({
    ...field,
    values: values[index],
  })),
};

return Promise.resolve(result);
The Business Charts function.
return {
  dataset: {
    source: context.editor.dataset.source,
  },
  tooltip: {
    trigger: "item",
  },
  series: [
    {
      name: "Access From",
      type: "pie",
      radius: "80%",
      emphasis: {
        itemStyle: {
          shadowBlur: 10,
          shadowOffsetX: 0,
          shadowColor: "rgba(0, 0, 0, 0.5)",
        },
      },
    },
  ],
};

