
Menu
Grafana Cloud
Enterprise
Open source
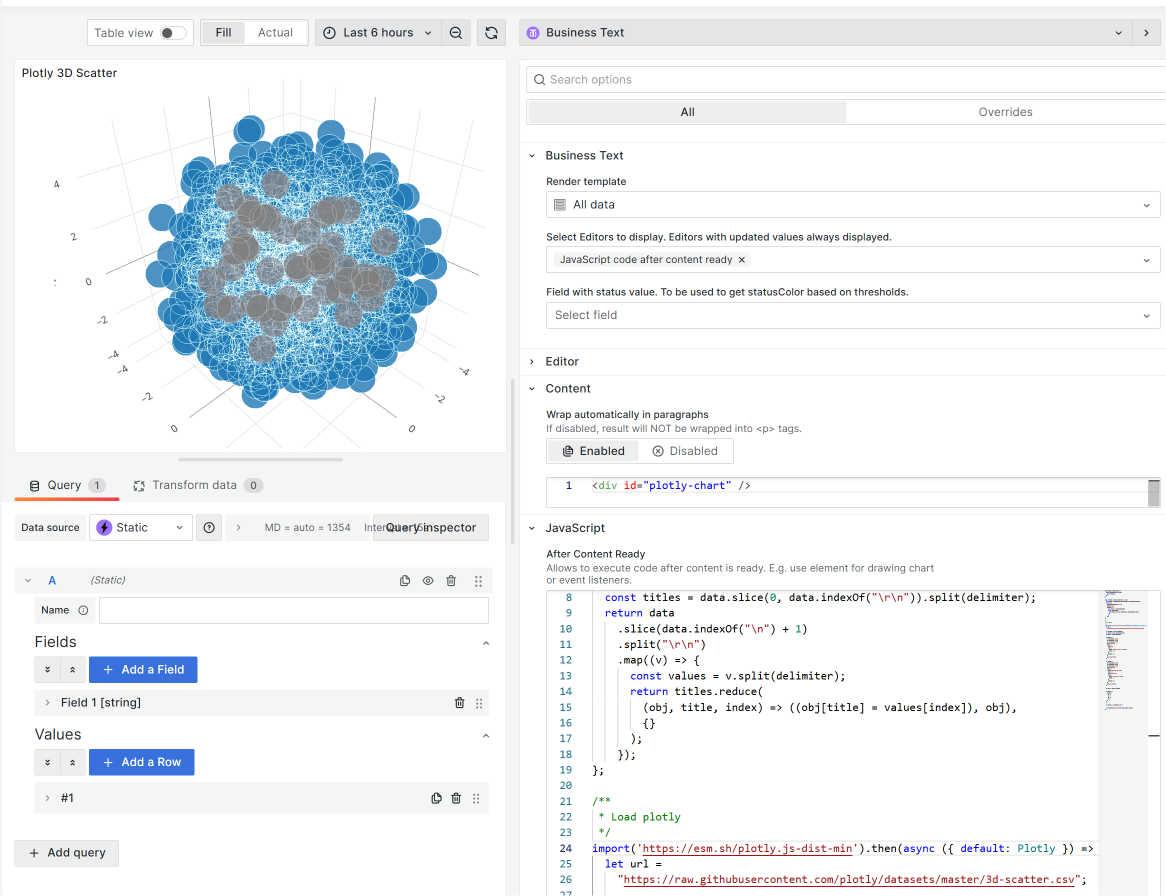
Plotly
Thanks to community member Josiah Solomon for providing this solution!
Use the following external Plotly’s chart library:
https://esm.sh/plotly.js-dist-minNote
Grafana’s edit mode might prevent displaying Plotly charts. Save and check the result on the dashboard.
Code to copy
Into the Content or Default Content:
<div id="plotly-chart" />After Content Ready
Warning
Plug-in libraries may change their versions and the code in the example may not work or cause an error.
Into the JavaScript > After Content Ready:
const unpack = (rows, key) => {
  return rows.map(function (row) {
    return row[key];
  });
};

const csvToJson = (data, delimiter = ",") => {
  const titles = data.slice(0, data.indexOf("\r\n")).split(delimiter);
  return data
    .slice(data.indexOf("\n") + 1)
    .split("\r\n")
    .map((v) => {
      const values = v.split(delimiter);
      return titles.reduce(
        (obj, title, index) => ((obj[title] = values[index]), obj),
        {}
      );
    });
};

/**
 * Load plotly
 */
import("https://esm.sh/plotly.js-dist-min@2.35.2").then(
  async ({ default: Plotly }) => {
    let url =
      "https://raw.githubusercontent.com/plotly/datasets/master/3d-scatter.csv";

    let fetchData = await fetch(url);
    let csvData = await fetchData.text();
    let rows = csvToJson(csvData);

    var trace1 = {
      x: unpack(rows, "x1"),
      y: unpack(rows, "y1"),
      z: unpack(rows, "z1"),
      mode: "markers",
      marker: {
        size: 12,
        line: {
          color: "rgba(217, 217, 217, 0.14)",
          width: 0.5,
        },
        opacity: 0.8,
      },
      type: "scatter3d",
    };

    var trace2 = {
      x: unpack(rows, "x2"),
      y: unpack(rows, "y2"),
      z: unpack(rows, "z2"),
      mode: "markers",
      marker: {
        color: "rgb(127, 127, 127)",
        size: 12,
        symbol: "circle",
        line: {
          color: "rgb(204, 204, 204)",
          width: 1,
        },
        opacity: 0.8,
      },
      type: "scatter3d",
    };

    var data = [trace1, trace2];

    var layout = {
      margin: {
        l: 0,
        r: 0,
        b: 0,
        t: 0,
      },
    };

    var config = { responsive: true };

    Plotly.newPlot("plotly-chart", data, layout, config);
  }
);
Example with different versions
For example, the link https://esm.sh/plotly.js-dist-min returns the latest stable version.
The code was written when the module returns version 2.35.2. Changing the module version caused an error.
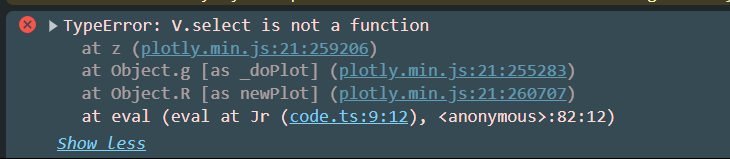
You should change the version to https://esm.sh/plotly.js-dist-min@2.35.2, or check the new version of the module and update the code.


