
Menu
Grafana Cloud
Enterprise
Open source
Leaflet.js
This example demonstrates external resource usage in the Business Text plugin. The idea comes from BlinderMiri and Josiah Solomon.
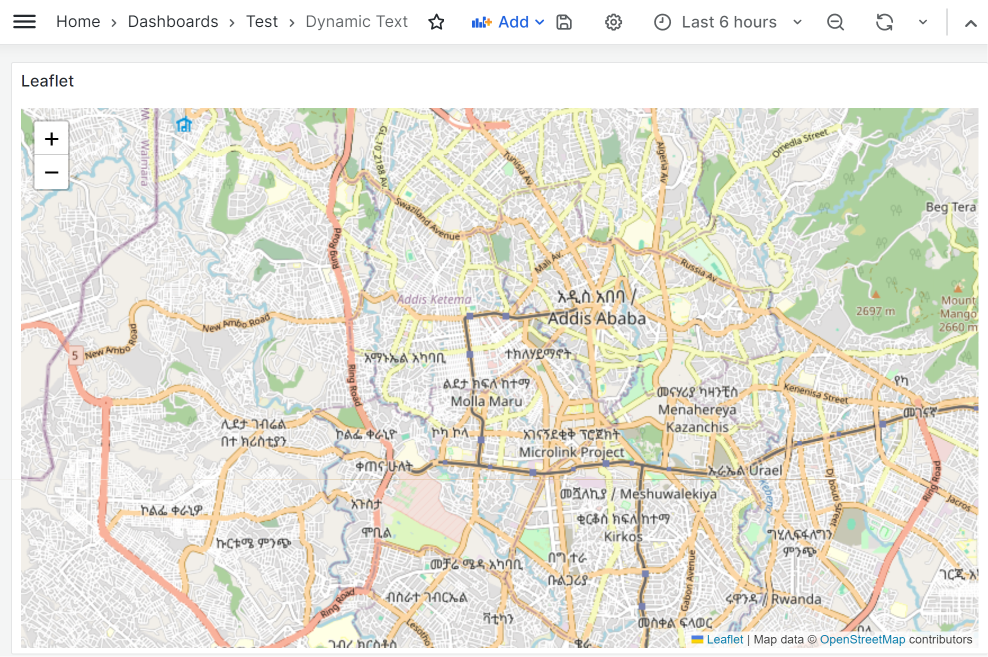
Follow the outlined steps to display Leaflet.js maps on your Grafana dashboard.
The following illustration shows the map on the dashboard from this example.
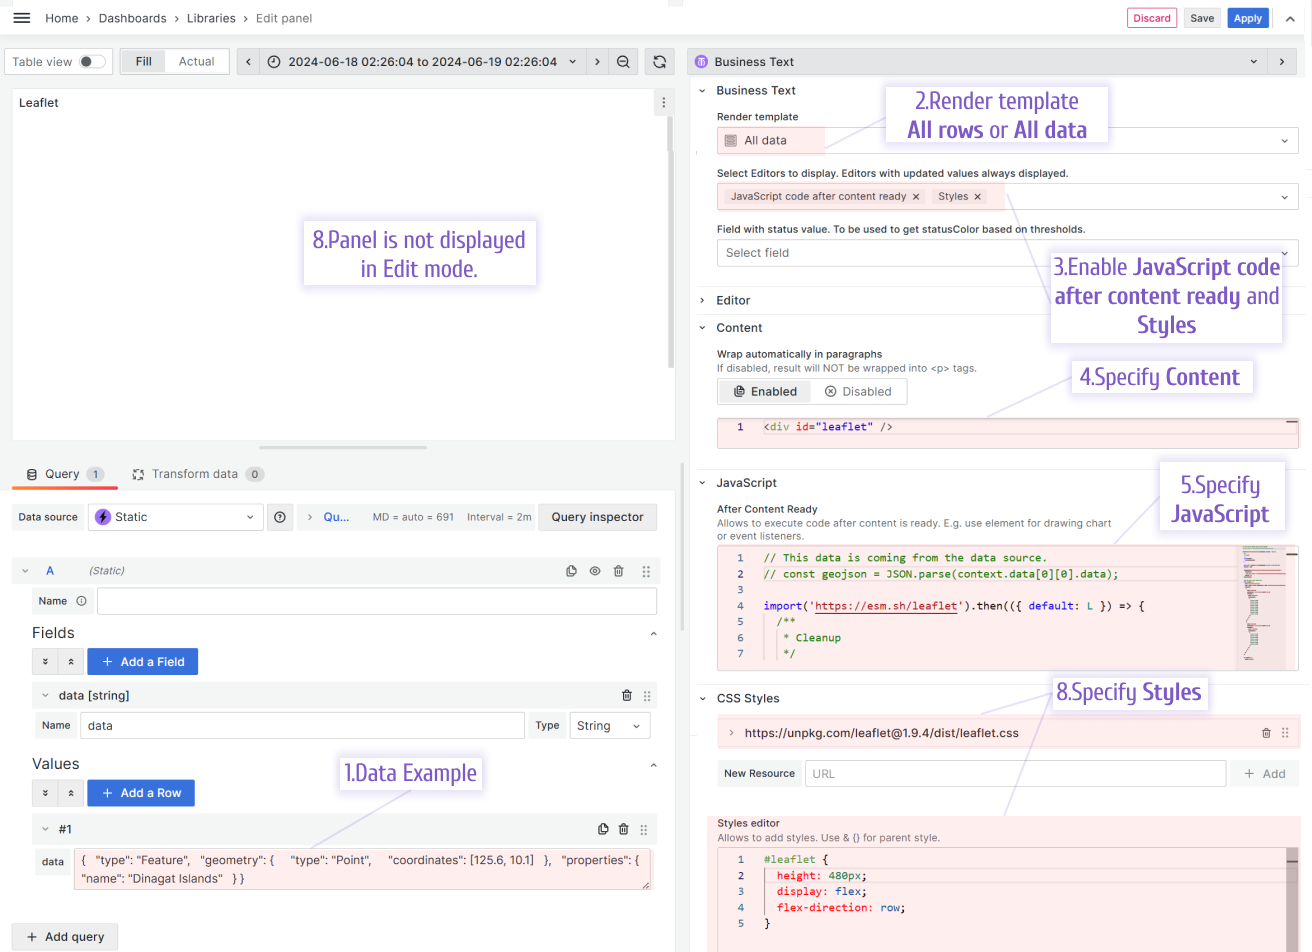
Data to copy
This example uses the Business Input Data Source.
{
  "geometry": {
    "coordinates": [
      125.6,
      10.1
    ],
    "type": "Point"
  },
  "properties": {
    "name": "Dinagat Islands"
  },
  "type": "Feature"
}
Content
<div id="leaflet" />After Content Ready
Warning
Plug-in libraries may change their versions and the code in the example may not work or cause an error.
Use the following for the JavaScript > After Content Ready:
// This data is coming from the data source.
// const geojson = JSON.parse(context.data[0][0].data);
import("https://esm.sh/leaflet").then(({ default: L }) => {
/**
* Cleanup
*/
if (this.map) {
this.map.remove();
}
const map = L.map("leaflet").setView([9.024857, 38.737607], 13);
this.map = map;
L.tileLayer("https://{s}.tile.openstreetmap.org/{z}/{x}/{y}.png", {
attribution:
'Map data © <a href="https://www.openstreetmap.org/">OpenStreetMap</a> contributors',
maxZoom: 18,
}).addTo(map);
//if you want to use inline data
const geojson = {
type: "FeatureCollection",
crs: {
type: "name",
properties: { name: "urn:ogc:def:crs:OGC:1.3:CRS84" },
},
features: [
{
type: "Feature",
properties: { AOIs: "bbb", daily: "33" },
geometry: {
type: "Polygon",
coordinates: [
[
[33.5, 32.0],
[33.5, 29.0],
[36.0, 29.0],
[36.0, 27.5],
[33.5, 27.5],
[32.5, 27.5],
[29.0, 27.5],
[29.0, 32.0],
[33.5, 32.0],
],
],
},
},
{
type: "Feature",
properties: { AOIs: "aaa", daily: "23" },
geometry: {
type: "Polygon",
coordinates: [
[
[34.5, 32.5],
[36.0, 32.5],
[36.0, 29.0],
[33.5, 29.0],
[33.5, 32.0],
[33.5, 32.5],
[34.5, 32.5],
],
],
},
},
],
};
var myStyle = {
color: "black",
weight: 10,
};
var geojsonLayer = L.geoJSON(geojson).addTo(map);
});CSS styles
Use the following external CSS
https://unpkg.com/leaflet@1.9.4/dist/leaflet.css#leaflet {
height: 480px;
display: flex;
flex-direction: row;
}

