Multidimensional SLI example
This guide explains what multidimensional SLIs are, how they work, how they compare with aggregated SLIs, and provides a basic example.
Before you begin, read the SLI availability examples and SLI query requirements to understand how SLIs are defined in Grafana SLO.
In the previous availability and latency SLI examples, SLIs are calculated using the ratio of successful event rates formula:
Success ratio = rate of successful events over a period
                /
                rate of total events over a period
However, this formula is incomplete, because Prometheus queries can return multiple series (also called dimensions).
In practice, the final SLI uses sum(...) to aggregate results from all series. The formula looks more like:
Success ratio = sum(rate of successful events over a period)
                /
                sum(rate of total events over a period)
Here, sum(...) aggregates all dimensions (distinct label values) in the numerator and denominator before the final ratio calculation. This type of SLI is referred to as a roll-up or aggregated SLI, where the SLI result returns only one series (dimension):

Multidimensional probe example
Multidimensional SLIs (SLIs evaluated across multiple label dimensions) use sum by (<labels>) in both the numerator and denominator, producing multiple ratio series. For example:
Success ratio = sum by (probe) (rate of successful probe executions)
                /
sum by (probe) (rate of total probe executions)The final SLI result is 0.9, equal to its equivalent roll-up SLI.
All dimensions are aggregated in the final SLI calculation, so for SLO compliance it behaves as a roll-up SLI.
The next example replicates the probe availability (summary) example, using the Grouping function to define dimensions per probe:

You can also create multidimensional SLIs using the Advanced option to write the SLI query directly.
Note
Each SLO creates a few recording rules that generate computed series for calculating the SLI and error budget more efficiently.
Multidimensional SLOs multiply the number of SLO series generated for each dimension, increasing the number of produced active series and data points per minute (DPM).
How multidimensional SLIs work
For SLO compliance evaluation, the SLI calculation for multidimensional and roll-up SLIs is exactly the same.
However, Grafana SLO provides additional functionality to handle multidimensional SLIs:
Fast and slow burn alerts per dimension. When enabled, Grafana SLO triggers fast-burn or slow-burn alerts whenever an individual dimension consumes the error budget quickly or slowly, respectively.

The SLO dashboard displays the list of multidimensional alerts Note
Multidimensional alerts are not triggered for overall SLO consumption, but only for the consumption of a particular dimension.
To be alerted when the overall error budget is consumed, create a roll-up SLO that does not include the
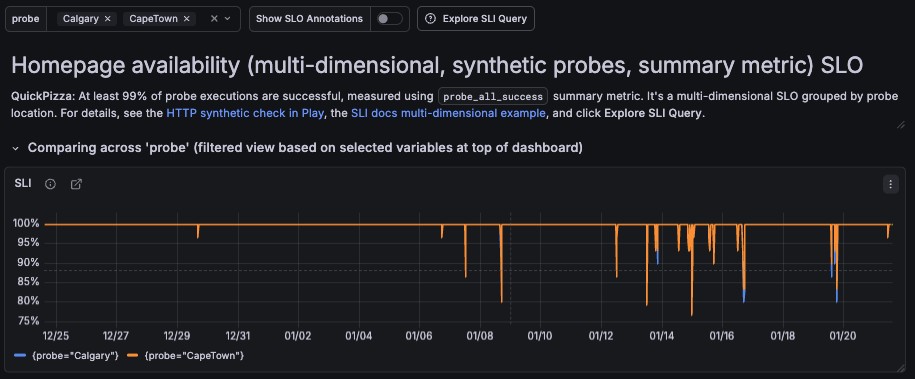
sum/group bydimensions.Per-dimension SLO dashboard filtering. The SLO dashboard allows filtering results and visualizing SLI consumption for each dimension.
![A screenshot of an SLO dashboard that displays SLI consumption per probe]()

Tip
In Grafana Play, you can explore and compare multidimensional and non-multidimensional SLOs. In the multidimensional SLO, you can filter by dimensions and observe error budgets and SLI values in real time, then click Explore SLI Query to inspect the underlying queries.
When to use multidimensional SLIs
Avoid using high-cardinality labels as dimensions, as this can lead to excessive series and inefficient SLI evaluation. To learn more about how Grafana evaluates metrics with multiple label dimensions, refer to multidimensional alert examples.
Multidimensional SLIs are useful when you want to observe SLI behavior across multiple dimensions, such as probe locations, regions, or services.
Use multidimensional SLIs when:
- You want visibility into per-dimension SLI behavior.
- You need per-dimension alerting (for example, burn-rate alerts per probe).
- Individual dimensions need to be observed separately.
Multidimensional SLIs do not change how SLO compliance is evaluated. For SLO compliance, all dimensions are aggregated into a single roll-up SLI.


