
Open a metric visualization in Explore
Explore is your gateway for querying, analyzing, and aggregating data in Grafana. It allows you to visually explore and iterate until you develop a working query or set of queries for building visualizations and conducting data analysis. If your data source supports graph and table data, there’s no need to create a dashboard, as Explore can display the results in both formats. This facilitates quick, detailed, real-time data analysis.
With Explore you can:
- Create visualizations to integrate into your dashboards.
- Create queries using mixed data sources.
- Create multiple queries within a single interface.
- Understand the shape of your data across various data sources.
- Perform real time data exploration and analysis.
Key features include:
- Query editor, based on specific data source, to create and iterate queries.
- Query history to track and maintain your queries.
- Query inspector to help troubleshoot query performance.
To open a metric visualization in Explore, complete the following steps:
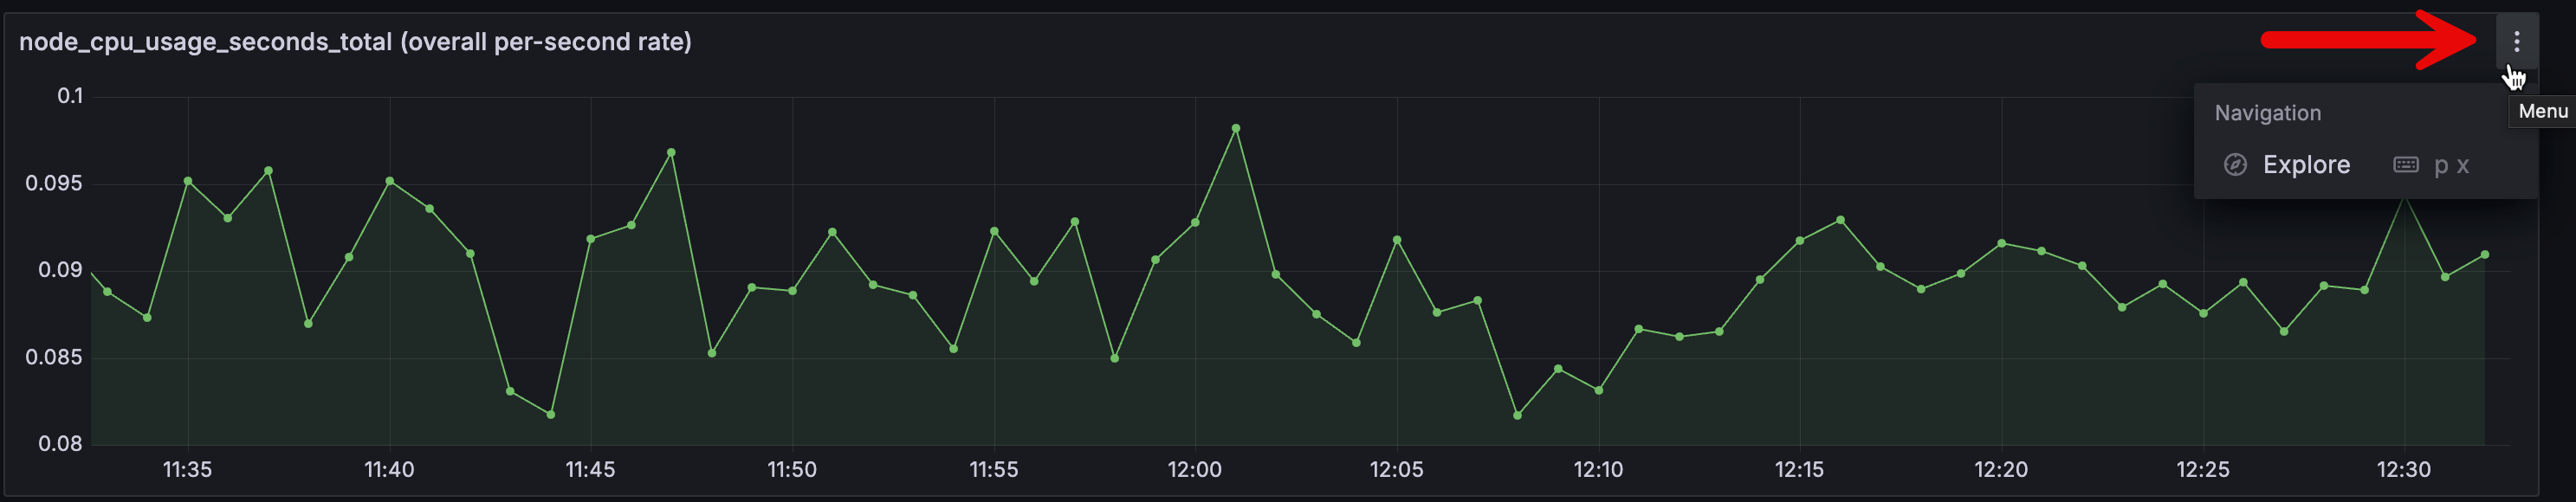
Hover your cursor over the metric you want to open in Explore.
Click the Menu icon, then click Explore.
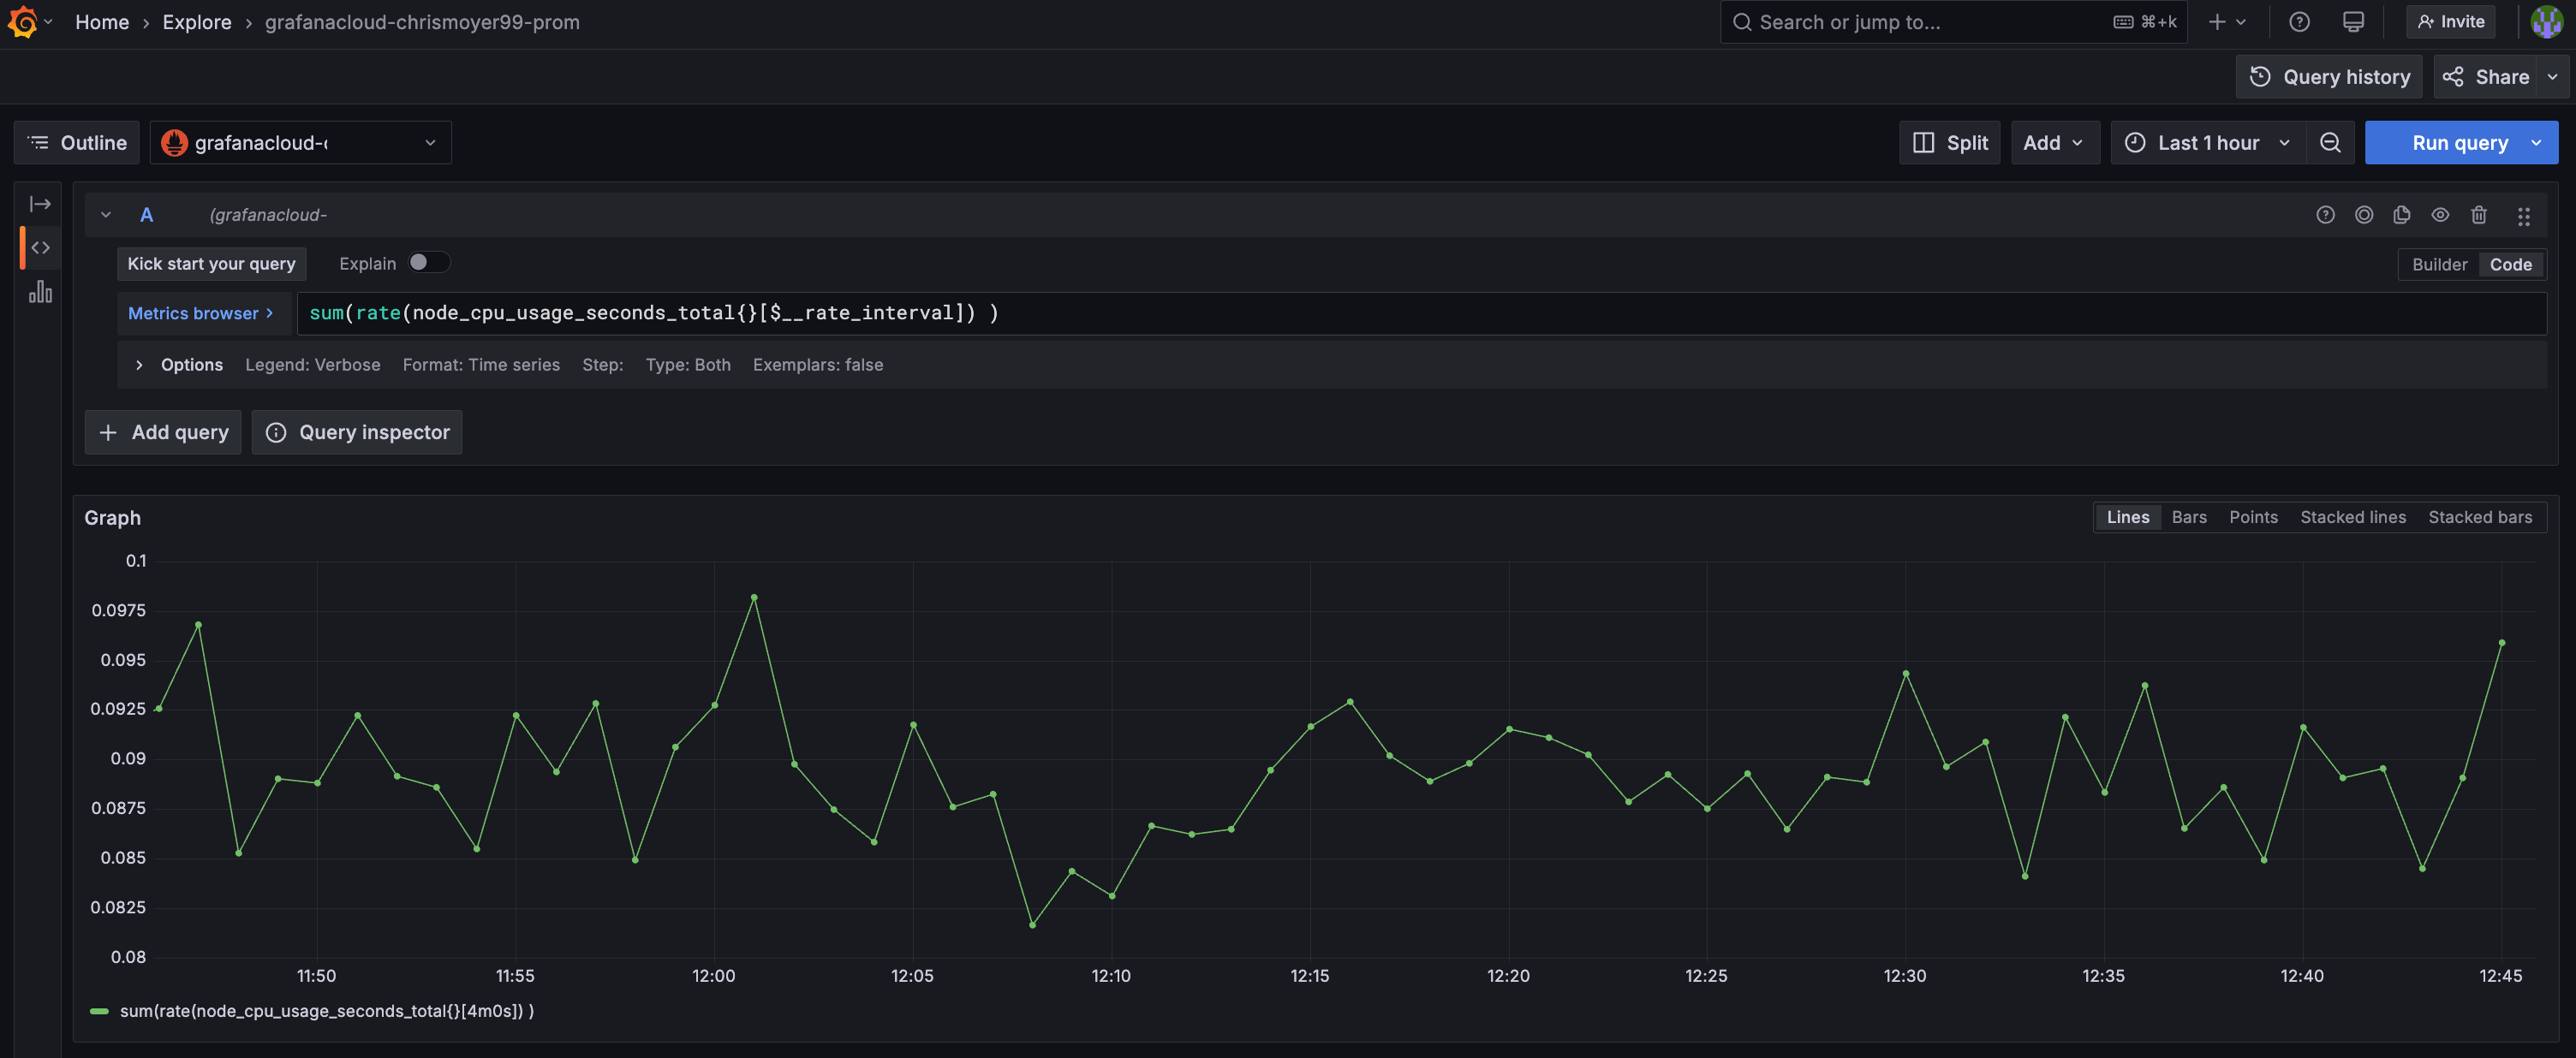
When the metrics visualization opens, you’ll see the query view. If needed, you can edit the query.
In your final milestone, you’ll learn how to add the visualization to a dashboard.