
Open in Grafana Cloud
Complete this learning path directly in your Grafana Cloud stack, or in the Grafana Play stack, with an interactive learning experience.
Monitor a Windows system in Grafana Cloud
Welcome to the Grafana learning journey that provides best practices for monitoring your Windows system.
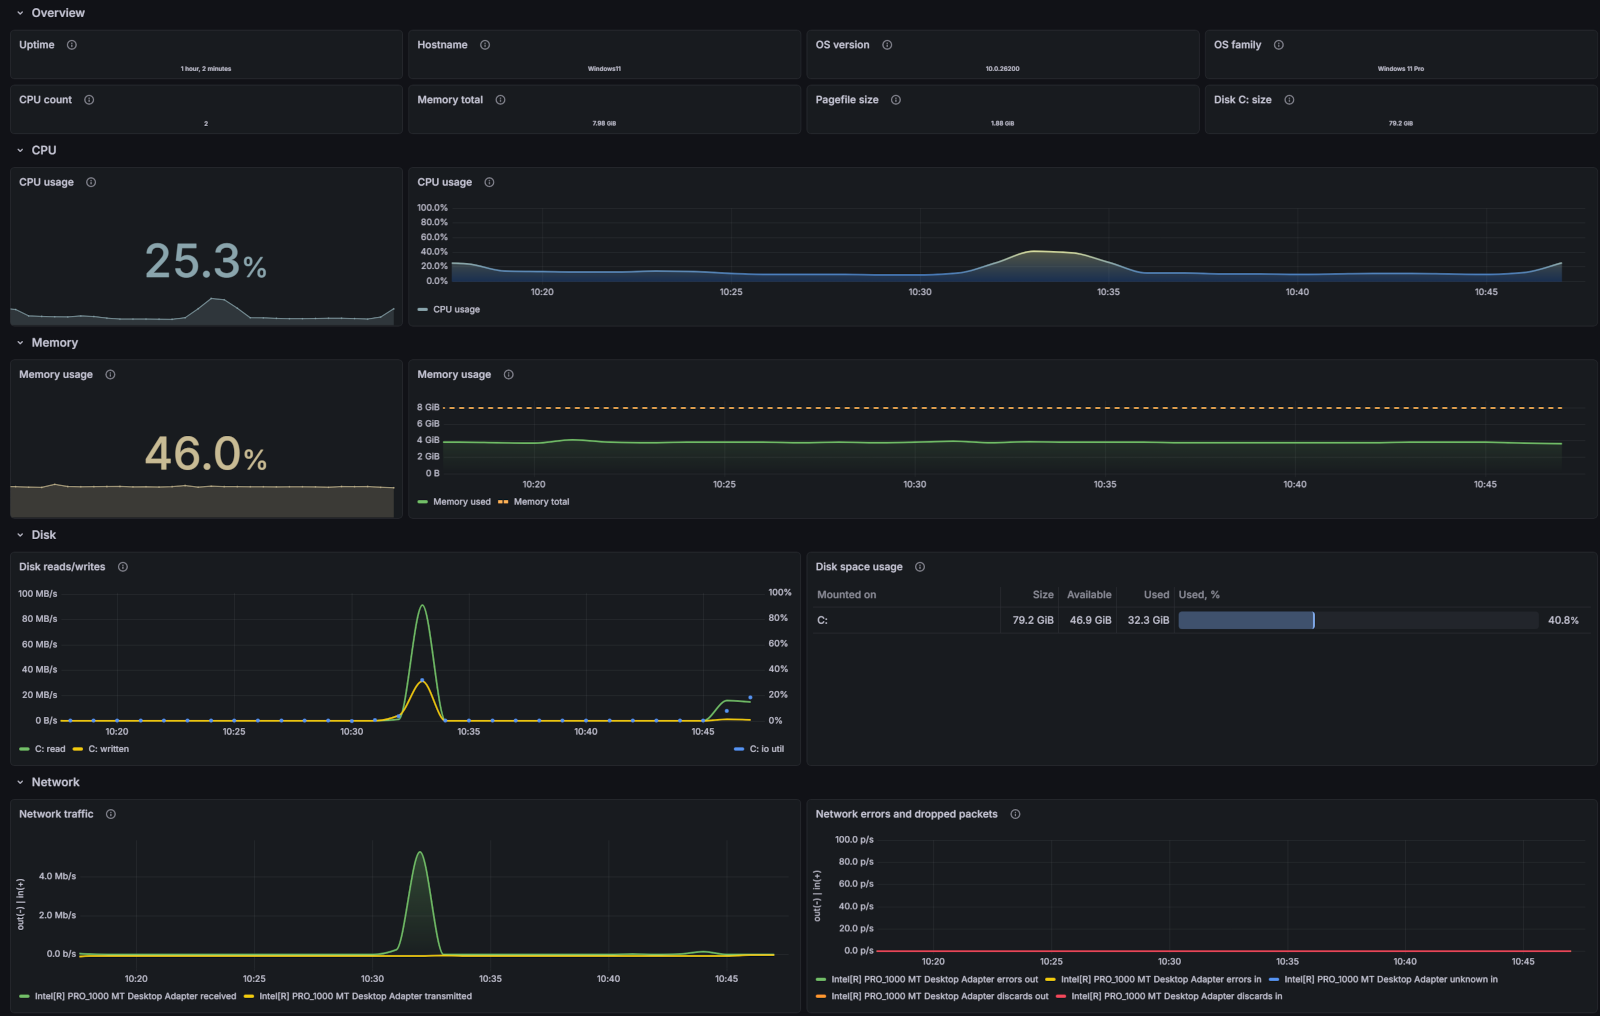
This journey involves implementing an integration that provides helpful alerts and pre-built dashboards to monitor metrics for Windows servers and desktops. Grafana’s Windows integration collects metrics related to the operating system, including aspects such as CPU usage, memory usage, disk and network I/O, and Windows services using the Windows exporter integration.
Here’s what to expect
When you complete this journey, you’ll be able to:
- Describe the benefits of using Grafana Cloud as your observability solution
- Set up a Windows integration and view telemetry data from your Windows system
- Use pre-built dashboards and alerts to identify and troubleshoot problems in your environment
Troubleshooting
If you get stuck, we’ve got your back! Where appropriate, troubleshooting information is just a click away.
More to explore
We understand you might want to explore other capabilities not strictly on this path. We’ll provide you opportunities where it makes sense.
Before you begin
Before you set up a Windows integration, ensure that you have:
- A Grafana Cloud account. To create an account, see Grafana Cloud.
- A Windows server or desktop with administrator privileges.
- Configured your firewall to allow outbound HTTPS (port 443) to
*.grafana.net.