
Understand PostgreSQL dashboards
The PostgreSQL integration provides two pre-built dashboards that you can use immediately to begin monitoring and troubleshooting database performance issues. In this step of the journey, you’ll become familiar with these pre-built dashboards and learn how to use them to address various problems.
While this journey focuses on configuring the PostgreSQL integration for one instance, the following dashboard images show the kinds of data you’ll see when you monitor multiple PostgreSQL instances across your infrastructure.
Did you know? If you don’t see any metrics, try switching the data source using the drop-down at the top of the dashboard.
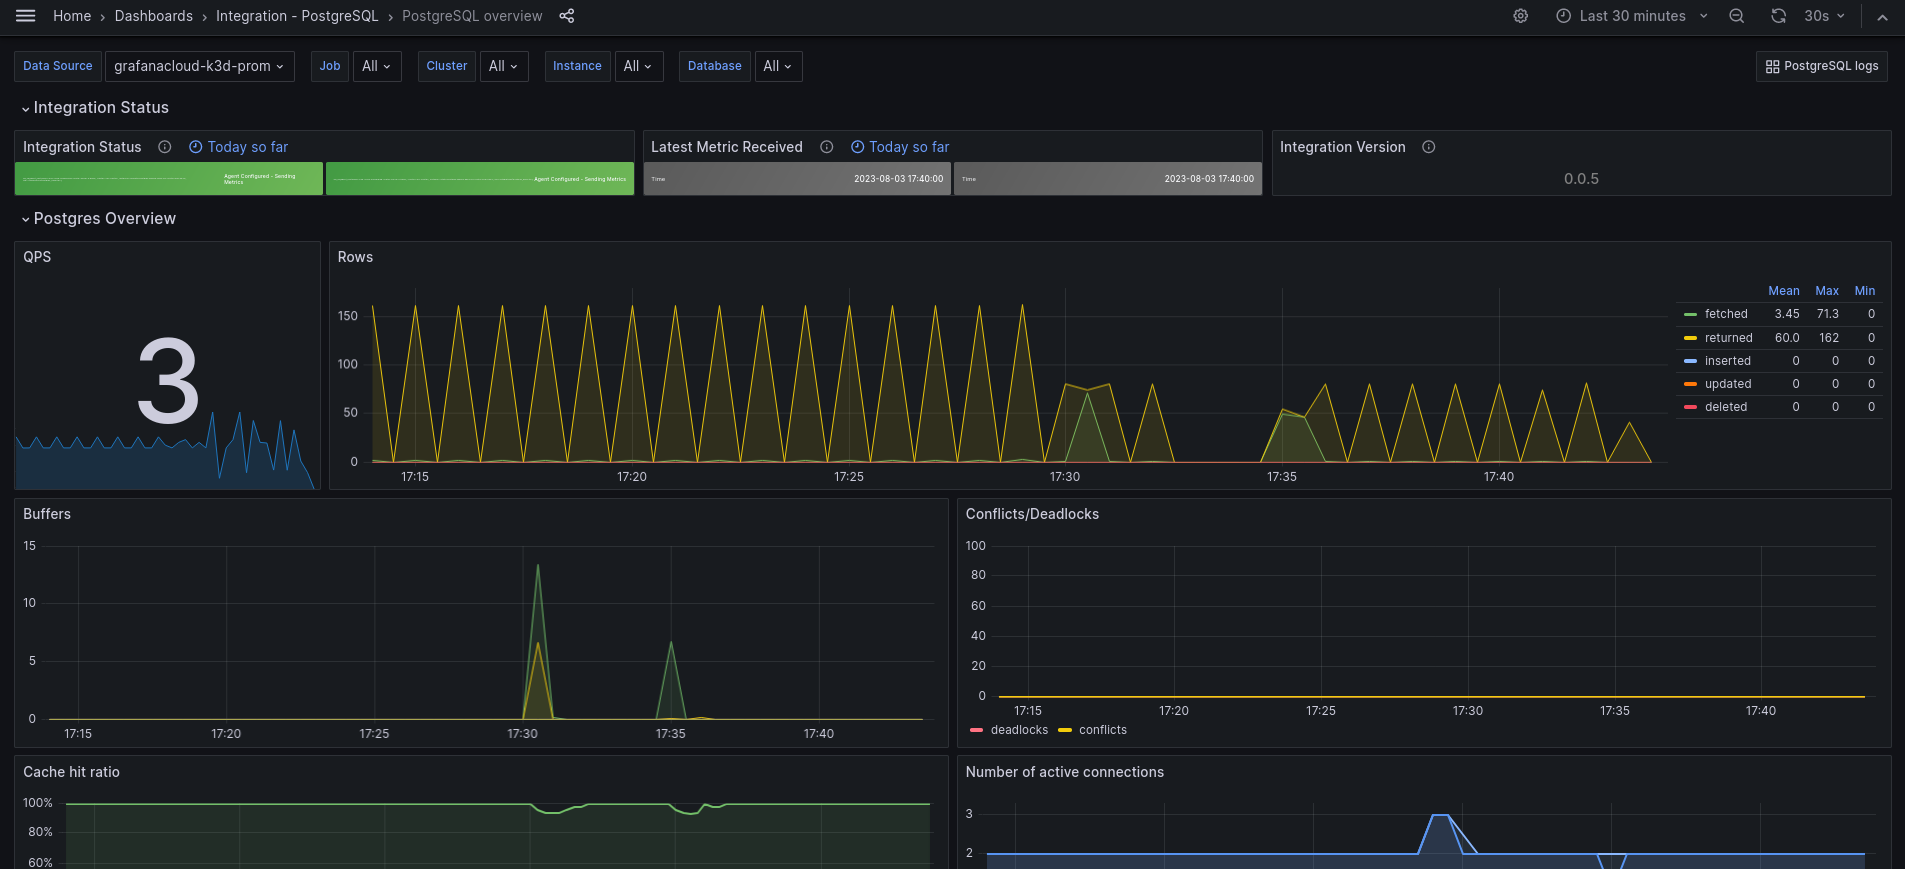
PostgreSQL overview dashboard
This dashboard provides a comprehensive overview of your PostgreSQL database performance and health, including:
- Connection metrics: active connections, connection rate, and connection limits
- Query performance: query rate, transactions per second, and database activity
- Cache performance: buffer hit ratios and cache efficiency metrics
- Database statistics: database size, tuple operations, and table statistics
- Lock monitoring: lock acquisition, deadlocks, and contention analysis
- Replication status: replication lag, standby status, and synchronization health
Use this dashboard to:
- Monitor overall database health and performance trends
- Track connection usage and identify potential connection bottlenecks
- Analyze cache performance and optimize buffer settings
- Monitor database growth and plan capacity requirements
- Identify lock contention and deadlock issues
- Ensure replication consistency and performance
PostgreSQL logs dashboard
This dashboard focuses on log analysis and troubleshooting, including:
- Error patterns: monitor error frequencies and types
- Authentication events: track connection attempts and security events
- Query analysis: review query patterns and identify problematic operations
- Database operations: monitor startup, shutdown, and maintenance events
- Performance insights: analyze slow queries and resource-intensive operations
Use this dashboard to:
- Troubleshoot database issues using comprehensive log analysis
- Monitor security events and authentication patterns
- Identify performance bottlenecks through query analysis
- Track database operational events and maintenance activities
- Ensure security compliance and audit trail requirements

In your final milestone, you’ll complete the PostgreSQL monitoring journey.
Troubleshooting
Explore the following troubleshooting topics if you need help:
Troubleshooting options
Please tell us what didn't work: