
Open in Grafana Cloud
Complete this learning path directly in your Grafana Cloud stack, or in the Grafana Play stack, with an interactive learning experience.
Monitor PostgreSQL databases with Grafana Alloy
Welcome to the Grafana learning journey that shows you how to monitor PostgreSQL databases with Grafana Alloy and use pre-built dashboards and alerts in Grafana Cloud.
PostgreSQL is a free and open source relational database management system (RDBMS) emphasizing extensibility and SQL compliance. By monitoring PostgreSQL with Grafana Alloy, you can track database performance, identify bottlenecks, and ensure optimal operation of your database infrastructure.
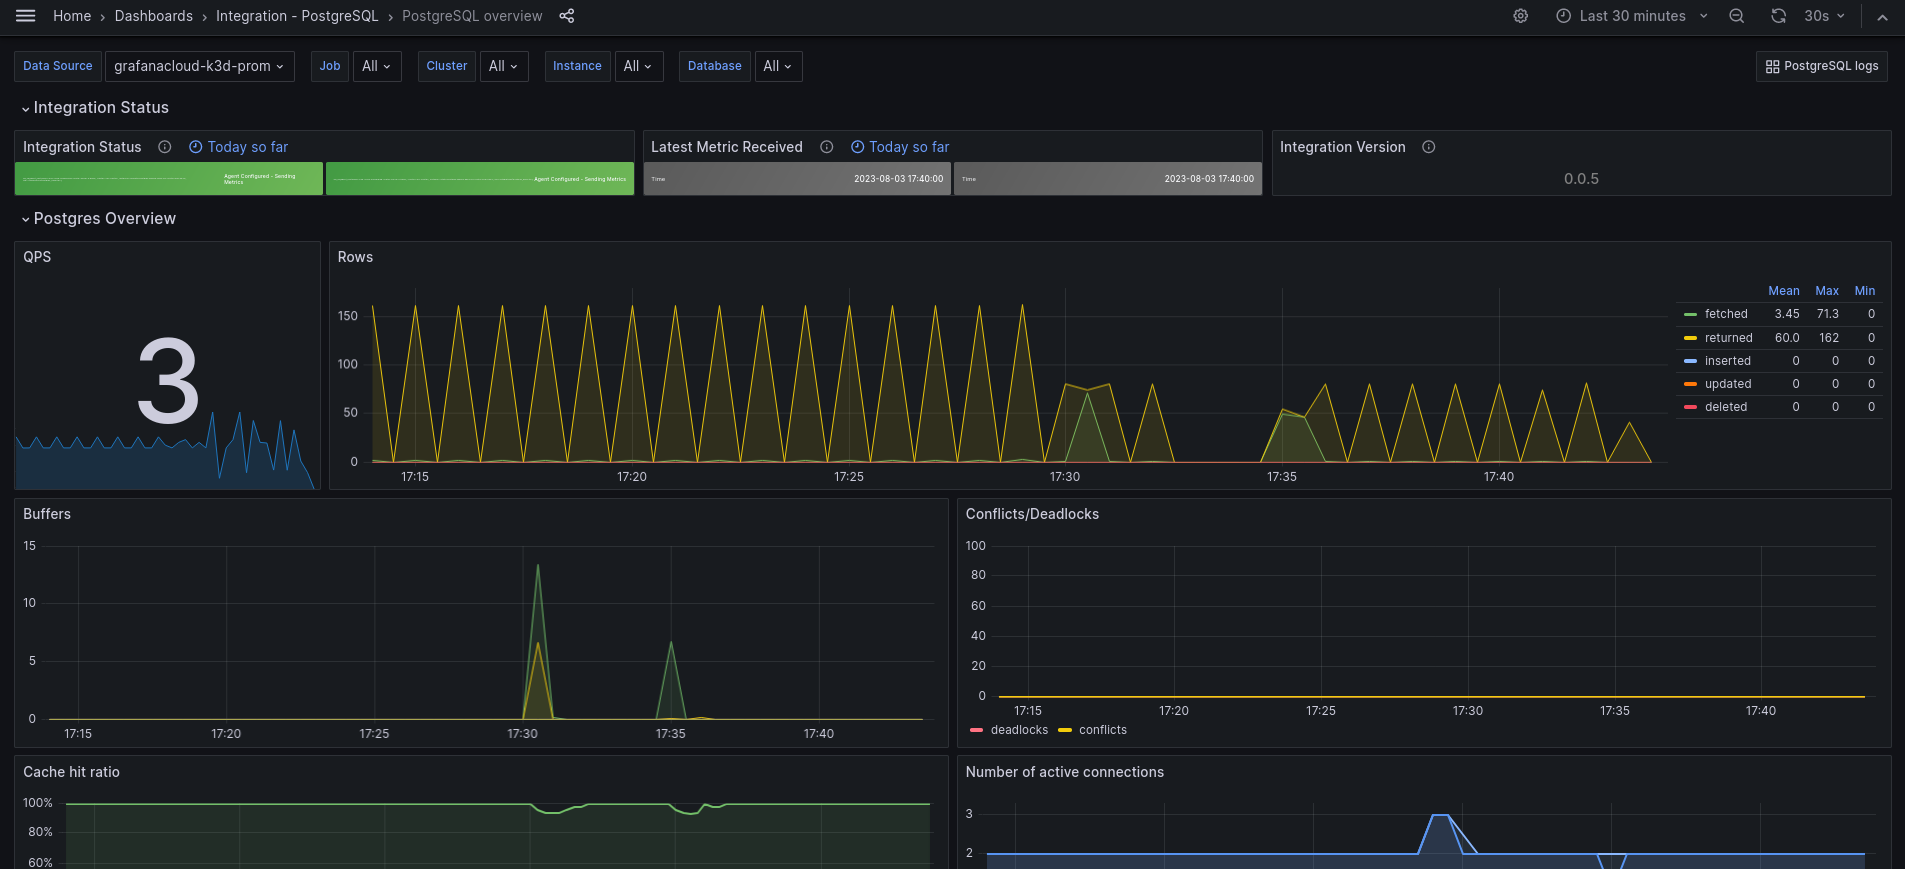
This integration includes 15 useful alerts and 2 pre-built dashboards to help monitor and visualize PostgreSQL metrics and logs. The dashboards provide comprehensive insights into database performance, including connection statistics, query performance, cache hit ratios, and replication status.
The image below shows an example PostgreSQL overview dashboard displaying key database metrics.
Here’s what to expect
When you complete this journey, you’ll be able to:
- Understand the value of monitoring PostgreSQL databases with Grafana Cloud
- Navigate to the PostgreSQL integration page in Grafana Cloud and select your platform environment
- Install Grafana Alloy on your system
- Prepare PostgreSQL database credentials and configuration
- Configure Grafana Alloy to collect PostgreSQL metrics and logs
- Test the connection to verify data collection
- Install and use pre-built dashboards and alerts to monitor PostgreSQL performance
Before you begin
Before you monitor PostgreSQL with Grafana Alloy, ensure that you have:
- A Grafana Cloud account. To create an account, refer to Grafana Cloud.
- A running PostgreSQL instance (PostgreSQL >= 9.5).
- Administrative access to your PostgreSQL server to create monitoring user accounts.
- Access to the machine where you want to install Grafana Alloy.
- Basic familiarity with PostgreSQL database administration and monitoring concepts.
Troubleshooting
If you get stuck, we’ve got your back! Where appropriate, troubleshooting information is just a click away.
More to explore
You might want to explore other capabilities not strictly on this path. Opportunities to explore additional features are provided where it makes sense.