
Explore your Azure dashboards and alerts
In this milestone, you’ll navigate and analyze the Azure metrics collected by Cloud Provider Observability.
Explore Azure service dashboards
To explore your Azure service data, complete the following steps:
Click the Services tab.
Locate and click the specific service in the list.
Use the Service or Source filters to find the service you want to explore.
For example, select Microsoft.Compute/virtualMachines to view Virtual Machine metrics.
If there are multiple instances of the service, select the specific instance you want to view.
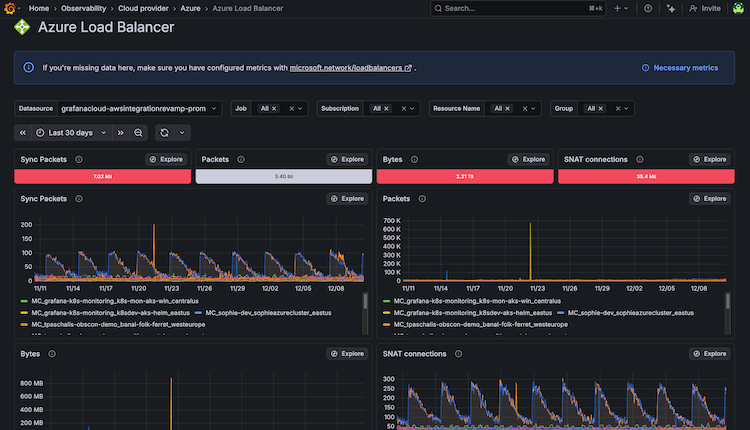
Explore the dashboard panels to understand your Azure resource performance.
Dashboards provide different metrics depending on the Azure service type. Common metrics include performance indicators, usage statistics, availability status, and operational health.
Use dashboard controls to customize your view:
Select a time range using the time picker in the upper right.
For example, select Last 24 hours to view recent performance.
Apply variable filters to focus on specific instances, resource groups, or subscriptions.
For example, select a specific resource group from the Resource Group dropdown.
To investigate specific metrics using Explore, click the Explore button on any panel.
Explore opens the metric in Grafana’s query interface for detailed analysis.
To see ML predictions for certain panels, click the Predict button.
For more information on this feature and how to enable it, refer to View predictions in the Cloud Provider Observability Azure documentation.
Insights from Azure data
Dashboards provide the following operational insights:
- Resource utilization patterns: Identify peak usage times and plan capacity accordingly across Virtual Machines, databases, and storage
- Performance bottlenecks: Spot consistently high CPU, memory, storage, or network utilization that may require optimization
- Cost optimization opportunities: Find underutilized resources that could be downsized or terminated to reduce Azure spending
- Availability monitoring: Track resource health and service uptime across your Azure environment
- Service dependencies: Understand relationships between Azure resources and identify potential cascading failure points
Explore Azure service alerts
If your Azure resources are functioning properly, you will see a green Normal tag in the Status column. If an alert is firing, you will see a red Firing tag in the State column.
To view and manage alerts:
In Grafana Cloud, navigate to Observability > Cloud Provider > Azure.
Click the Alerts tab to view all active alerts.
Review the Summary column for each alert. Click the tooltip icon to see recommendations for alert resolution.
Click an alert name in the Alert column to view the dashboard for that specific service.
Analyze alerts by using the Analyze with Assistant button.
View the expression used to create the alert by clicking the arrow icon next to the alert’s name.
To adjust the query an alert uses, click the Go to Alerting button.
For more information about available dashboards and alerts, refer to Preconfigured dashboards and alerts for Azure metrics.
In your final milestone, you’ll celebrate completing this Azure monitoring journey and discover additional resources for expanding your observability capabilities.