
Explore your AWS service data
In this milestone, you’ll navigate and analyze the AWS metrics collected by Cloud provider. Cloud provider offers pre-built dashboards optimized for AWS services, along with powerful exploration tools to investigate performance patterns and identify potential issues.
Cloud provider AWS can deploy dashboards for each service you’re monitoring, providing immediate insights into resource utilization, performance trends, and operational health.
To explore your AWS service data, complete the following steps:
In Grafana Cloud, select Observability > Cloud provider > AWS in the main menu.
Install preconfigured dashboards and alerts:
Click the Configuration tab at the top of the Cloud provider AWS page.
Scroll down to the Dashboards and Alerts Installation section and click Install dashboards and alerts.
Click the Services tab.
Locate and click the specific service or source in the list.
Use the Service or Source filters to find the service or source you want to see.
For example, select AWS EC2 to view EC2 instance metrics.
Select the instance ID for the instance you want to see, if there are multiple instances.
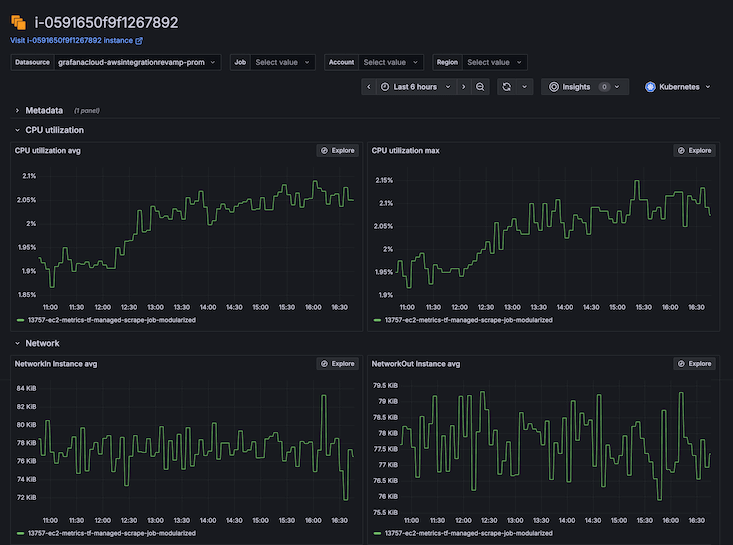
Explore the dashboard panels to understand your AWS resource performance.
For instance, if you select a specific EC2 instance, you can explore the following panels:
Review CPU Utilization panels to identify high-load instances.
Examine Network charts to understand data transfer patterns.
Check Disk Ops metrics to spot storage bottlenecks.
Monitor Instance Status to verify resource health.
Use dashboard controls to customize your view:
Select a time range using the time picker in the upper right.
For example, select Last 24 hours to view recent performance.
Apply variable filters to focus on specific instances or regions.
For example, select us-east-1 from the Region dropdown.
To investigate specific metrics using Explore, click the Explore button on any interesting panel.
Explore opens the metric in Grafana’s query interface for detailed analysis.
Insights from AWS data
Dashboards provide the following operational insights:
- Resource utilization patterns: Identify peak usage times and plan capacity accordingly
- Performance bottlenecks: Spot consistently high CPU, memory, or I/O utilization that may require optimization
- Cost optimization opportunities: Find under-utilized resources that could be downsized or terminated
- Availability monitoring: Track instance health and service uptime across your AWS environment
In your final milestone, you’ll celebrate completing this AWS monitoring journey and discover additional resources for expanding your observability capabilities.