
Open in Grafana Cloud
Complete this learning path directly in your Grafana Cloud stack, or in the Grafana Play stack, with an interactive learning experience.
Monitor AWS resources with Grafana Cloud
Welcome to the Grafana learning journey that shows you how to monitor AWS resources using Grafana Cloud Provider Observability. This journey teaches you to connect your AWS account to Grafana Cloud and monitor your AWS services through comprehensive dashboards and metrics.
Grafana Cloud Provider Observability provides seamless monitoring for your AWS infrastructure without requiring additional setup or maintenance overhead. The Cloud provider AWS solution collects metrics from Amazon CloudWatch and presents them through pre-built dashboards optimized for AWS services.
The Cloud provider AWS solution differs from traditional monitoring solutions by providing a unified observability platform that offers centralized access and management. This approach gives you complete visibility into your AWS environment alongside other infrastructure components.
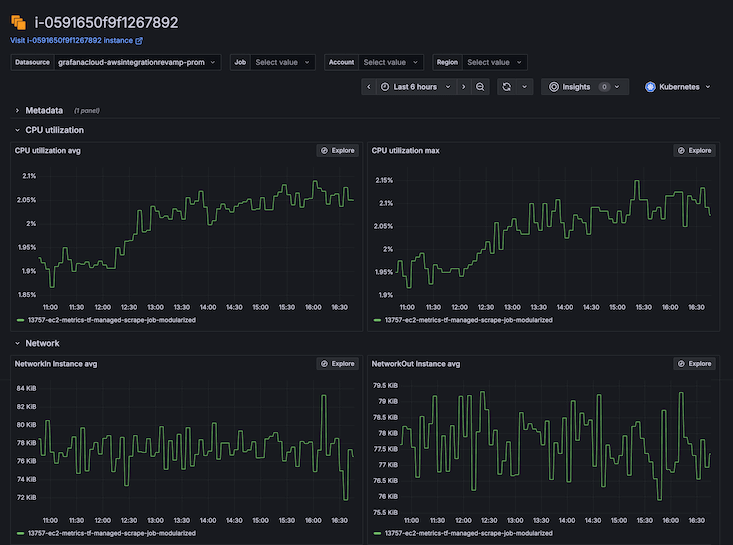
The following example dashboard image shows an AWS EC2 instance’s metrics including CPU utilization and network traffic:
Here’s what to expect
When you complete this journey, you’ll be able to:
- Understand the value of observability and the advantages of Grafana Cloud Provider Observability
- Navigate to the Cloud provider AWS configuration interface in Grafana Cloud
- Create an AWS IAM role with appropriate permissions for monitoring
- Connect your AWS account to Grafana Cloud
- Create scrape jobs to collect metrics from AWS services
- Verify data is collected and sent to Grafana Cloud
- Explore AWS service data using pre-built dashboards
Before you begin
Before you monitor AWS resources, ensure that you have:
- A Grafana Cloud account. To create a free account, go to Grafana Cloud and enter an email address and password.
- An AWS account with administrative access or appropriate IAM permissions to create roles and policies.
- AWS resources running that you want to monitor, such as EC2 instances, RDS databases, or Lambda functions and at least one Amazon tag on the resources in AWS so AWS can ingest metrics from CloudWatch into Grafana Cloud.
- Basic familiarity with AWS services and understanding of their operation.
Troubleshooting
If you get stuck, we’ve got your back. Where appropriate, troubleshooting information is just a click away.
More to explore
We understand you might want to explore other capabilities not strictly on this path. We’ll provide you opportunities where it makes sense.