
Open in Grafana Cloud
Complete this learning path directly in your Grafana Cloud stack, or in the Grafana Play stack, with an interactive learning experience.
Monitor Kafka with Grafana Cloud
Welcome to the Kafka monitoring learning journey that shows you how to use Grafana Alloy to send Kafka metrics to Grafana Cloud for comprehensive event streaming observability.
Apache Kafka is a distributed event streaming platform used by thousands of companies for high-performance data pipelines, streaming analytics, data integration, and mission-critical applications. Monitoring Kafka performance is critical for maintaining optimal cluster operations, identifying bottlenecks, and ensuring reliable data streaming.
Grafana Alloy is a vendor-neutral distribution of the OpenTelemetry Collector. Alloy offers native pipelines for OpenTelemetry, Prometheus, Pyroscope, and Loki without the need to operate multiple agents. The single binary deploys anywhere and automatically scales up or down based on send volume.
This integration includes pre-built dashboards and alerts to help monitor and visualize Kafka metrics, providing insights into broker performance, topic statistics, consumer lag, and cluster health.
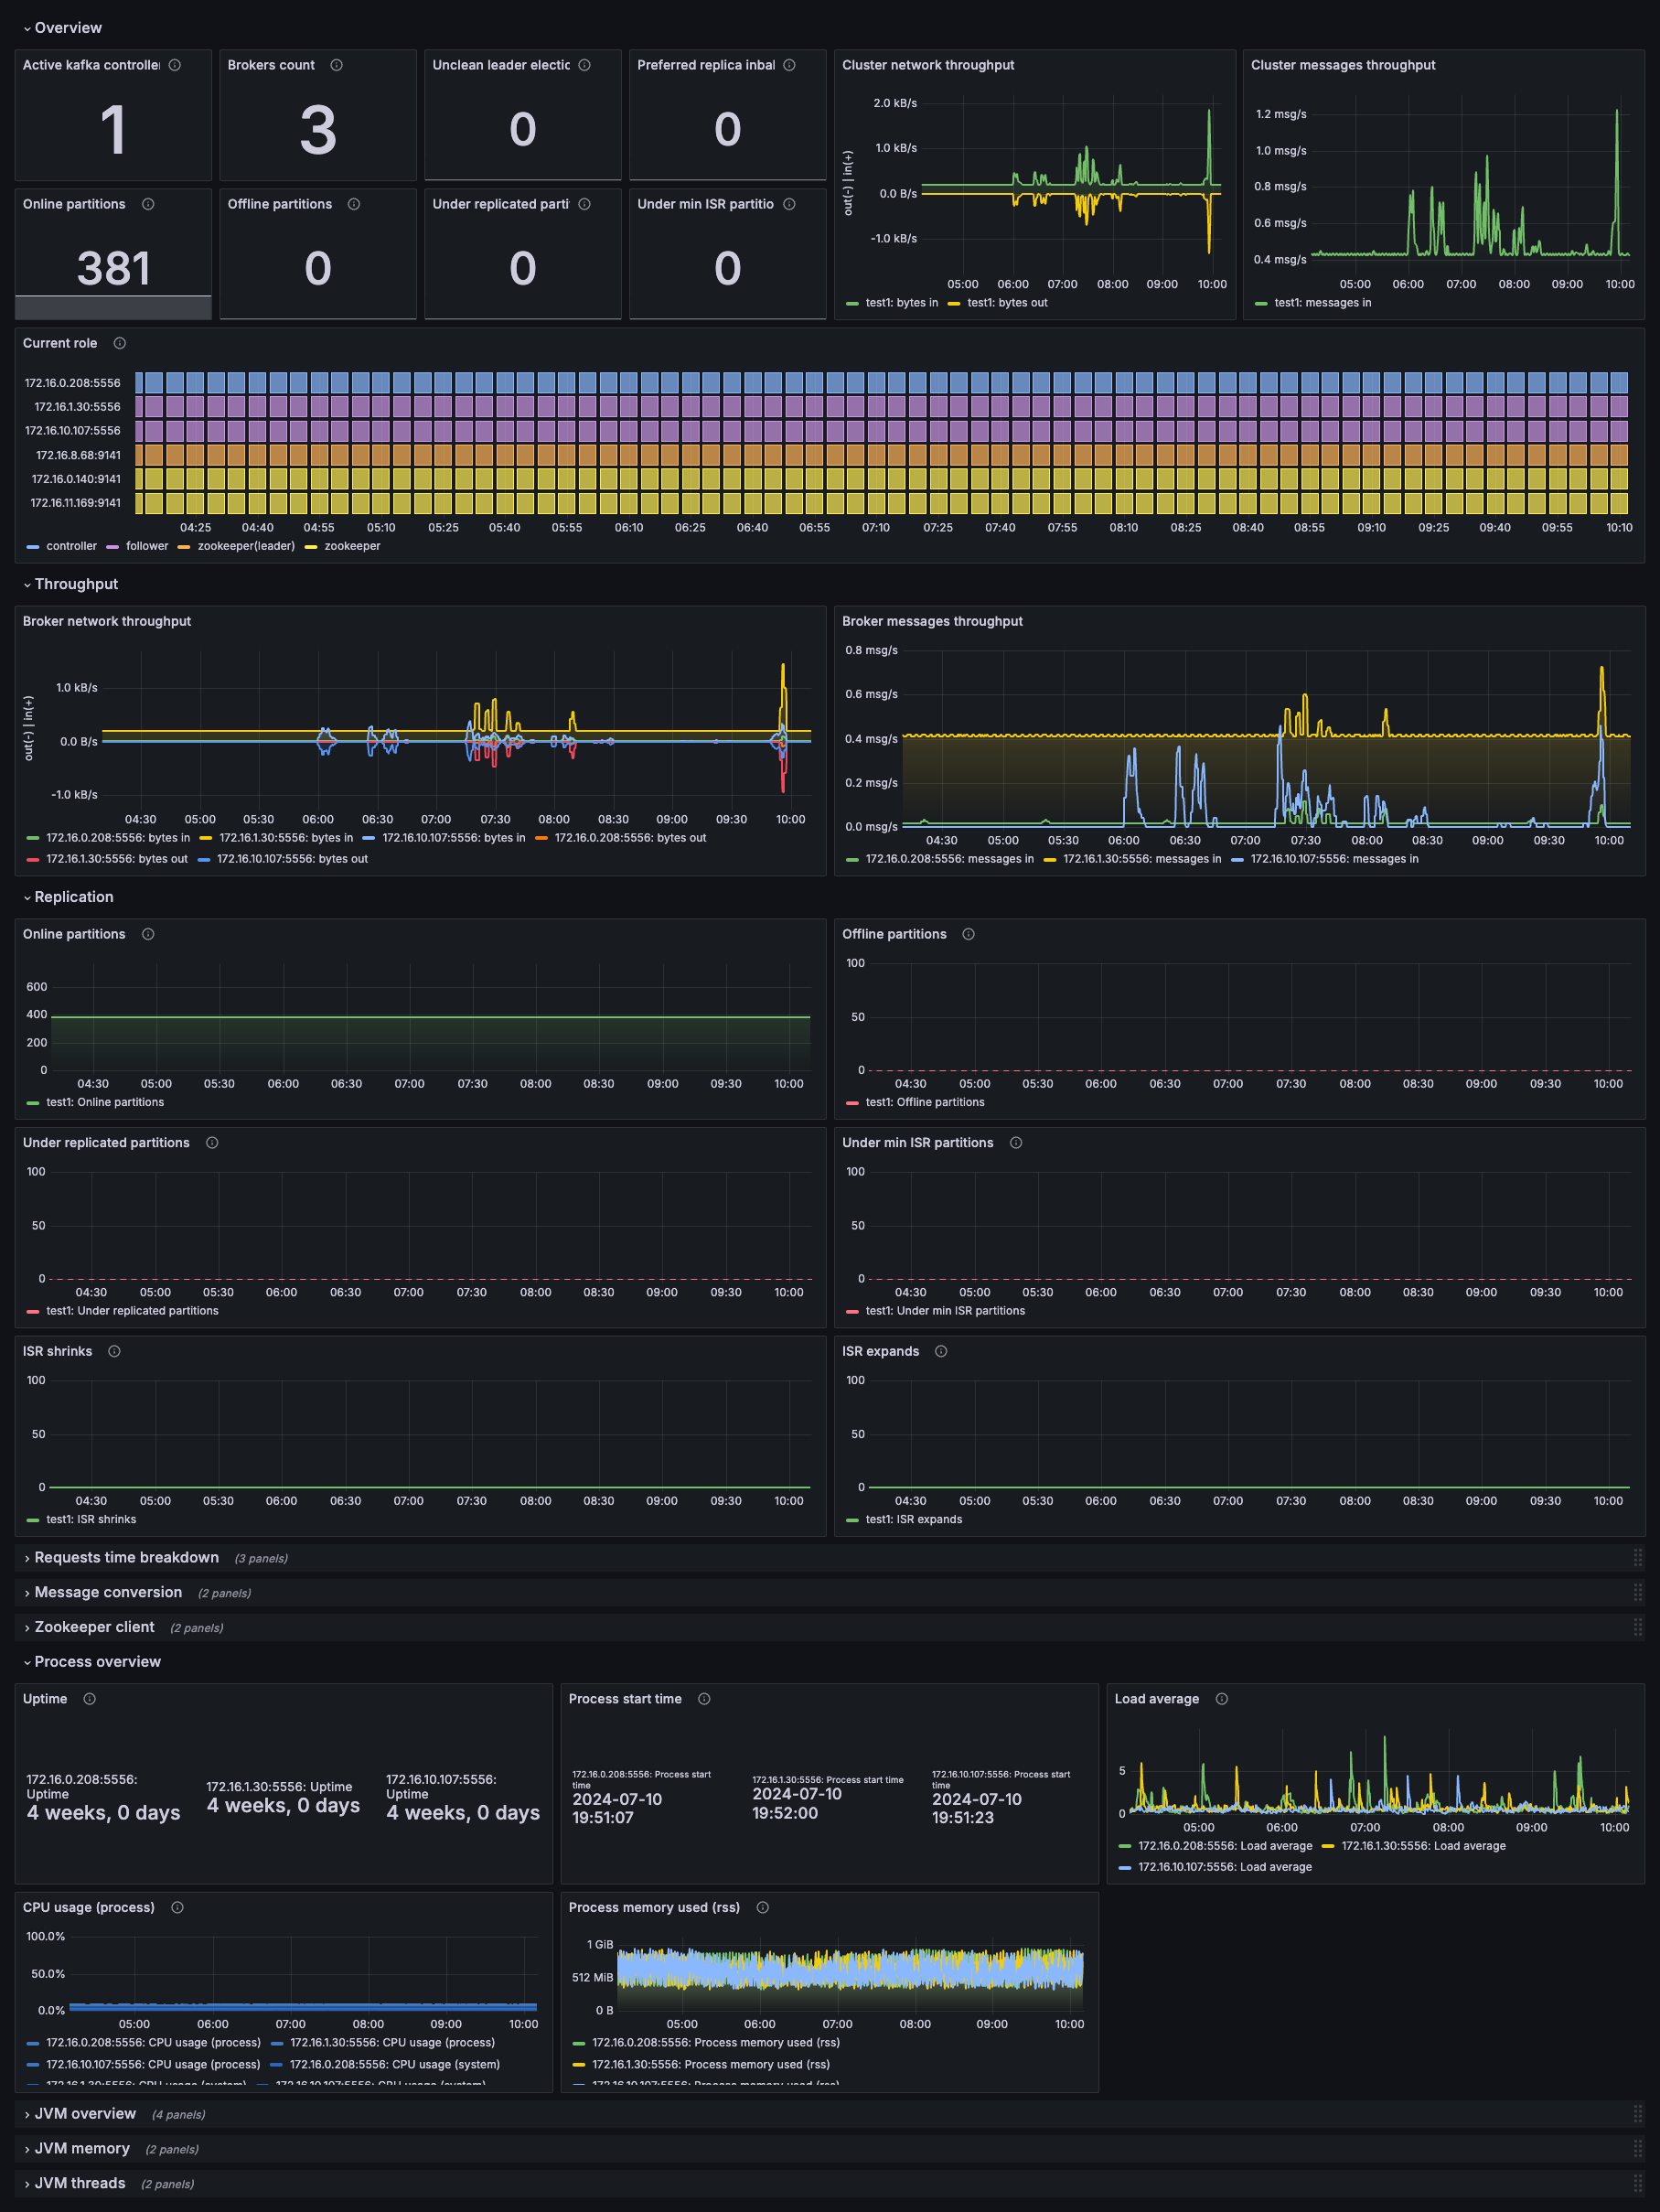
The following dashboard displays key Kafka cluster metrics including active controllers, broker count, partition health, throughput statistics, and JVM performance indicators.
Here’s what to expect
When you complete this journey, you’ll be able to:
- Understand the value of Kafka monitoring and observability.
- Recognize the advantages of using Grafana Alloy for Kafka metrics collection.
- Install Grafana Alloy on a machine with access to your Kafka brokers.
- Configure JMX remote access on your Kafka brokers to expose metrics.
- Configure Grafana Alloy to scrape JMX metrics from your Kafka cluster.
- Verify that Kafka metrics are flowing to Grafana Cloud.
- Install and explore pre-built Kafka dashboards showing cluster health and performance.
- Interpret key Kafka metrics to identify healthy operation versus potential issues.
Before you begin
Before you monitor Kafka using Grafana Alloy, ensure that you have:
- A Grafana Cloud account. To create an account, refer to Grafana Cloud.
- A Kafka cluster up and running (local, cloud-hosted, or containerized).
- Network access between the machine on which you are installing Grafana Alloy and your Kafka brokers’ JMX ports.
- Administrator or root access to your Kafka broker servers to configure JMX settings.
- Access to the machine where you’ll install Grafana Alloy with administrator privileges.
Troubleshooting
If you get stuck, we’ve got your back! Where appropriate, troubleshooting information is just a click away.
More to explore
We understand you might want to explore other capabilities not strictly on this path. We’ll provide you opportunities where it makes sense.