
Build a dashboard using the Infinity data source
A Grafana dashboard is a set of one or more panels, organized and arranged into one or more rows, that provide an at-a-glance view of related information. These panels are created using components that query and transform raw data from a data source into visualizations.
A data source can be an SQL database, Grafana Loki, Grafana Mimir, or an API endpoint. It can even be a basic CSV file. Data source plugins take a query you want answered, retrieve the data from the data source, and reconcile the differences between the data model of the data source and the data model of Grafana dashboards.
The instructions in this milestone are based on the publicly available Traffic density JSON file, which has the following structure.
{
  "channel": {
    "id": 38629,
    "name": "Traffic Monitor",
    "description": "Traffic Monitor showing density of cars detected",
    "latitude": "42.28",
    "longitude": "-71.35",
    "field1": "Density of Westbound Cars",
    "field2": "Density of Eastbound Cars",
    "created_at": "2015-05-19T20:14:03Z",
    "updated_at": "2019-07-24T20:12:00Z",
    "last_entry_id": 18679924
  },
  "feeds": [
    {
      "created_at": "2025-04-02T17:44:34Z",
      "entry_id": 18679825,
      "field1": "7.000000",
      "field2": "7.000000"
    },
To build a dashboard with the Infinity data source, complete the following steps:
Search for the Infinity data source and select it.
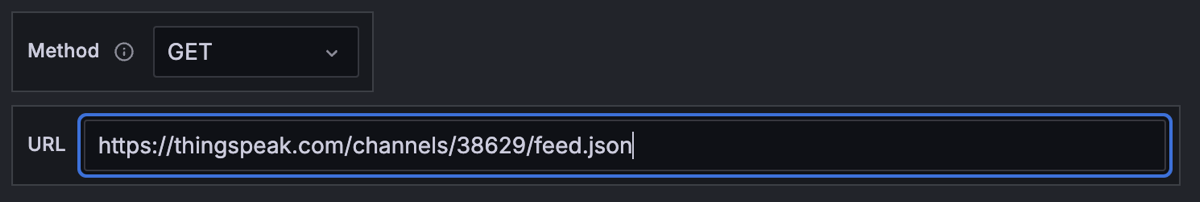
In the URL field, enter the URL endpoint of the JSON data you want to visualize.
For example:
https://thingspeak.com/channels/38629/feed.json![Example that shows a populated URL]()
Expand Parsing options & Result fields.
In the Rows/Root field, enter a row name.
For example, enter
feeds.Click Add Columns.
Complete the following fields:
- Selector, for example
created_at - Title, for example
Created at - format as, for example
Time
- Selector, for example
Continue adding columns, as necessary.
Click Refresh.
You should see a dashboard preview.
Click Save dashboard.
Enter a message and click Save.
Did you know?
Many APIs return more data than what you want to show in Grafana. For example, they might return metadata about the number of records, the last time the data was updated, or sensor location. The Infinity data source gives you the ability to specify the section of data that’s relevant for your graph. In the traffic density data, the relevant section is the
feedsfield. Specifying this field means that the visualization will only contain data that belongs to that section.
The dashboard is now available for others to see.
At this point in your journey, you can explore the following paths: