
Build a dashboard using the Infinity data source
A Grafana dashboard is a set of one or more panels, organized and arranged into one or more rows, that provide an at-a-glance view of related information. These panels are created using components that query and transform raw data from a data source into visualizations.
A data source can be an SQL database, Grafana Loki, Grafana Mimir, or an API endpoint. It can even be a basic CSV file. Data source plugins take a query you want answered, retrieve the data from the data source, and reconcile the differences between the data model of the data source and the data model of Grafana dashboards.
The instructions in this milestone are based on the publicly available Traffic density CSV file, which has the following structure.
created_at,entry_id,field1,field2
2025-04-07 12:19:26 UTC,18706390,6.000000,20.000000
2025-04-07 12:19:41 UTC,18706391,4.000000,19.000000
2025-04-07 12:19:56 UTC,18706392,8.000000,25.000000
2025-04-07 12:20:11 UTC,18706393,7.000000,27.000000
2025-04-07 12:20:26 UTC,18706394,8.000000,25.000000
2025-04-07 12:20:42 UTC,18706395,11.000000,29.000000
2025-04-07 12:20:57 UTC,18706396,15.000000,28.000000
2025-04-07 12:21:13 UTC,18706397,11.000000,18.000000
2025-04-07 12:21:29 UTC,18706398,4.000000,18.000000
2025-04-07 12:21:44 UTC,18706399,12.000000,20.000000
2025-04-07 12:21:59 UTC,18706400,5.000000,21.000000
To build a dashboard with the Infinity data source, complete the following steps:
Search for the Infinity data source and select it.
In the Type dropdown field, select CSV.
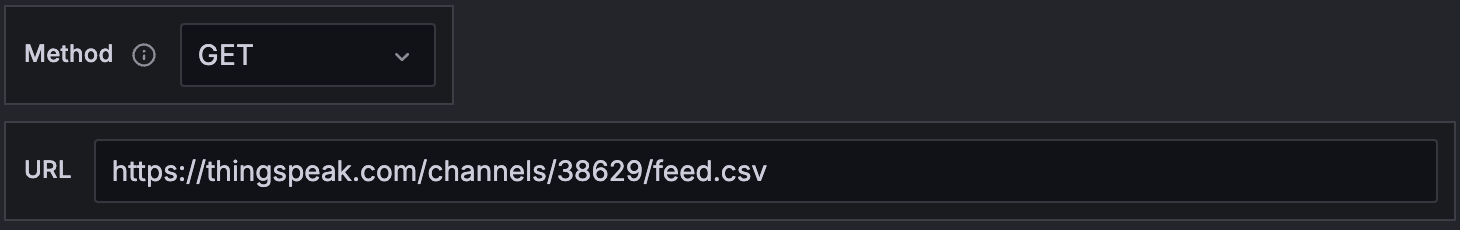
In the URL field, enter the URL endpoint of the CSV data you want to visualize.
For example:
https://thingspeak.com/channels/38629/feed.csv![Example that shows a populated URL]()
Expand Parsing options & Result fields.
In the Advanced Options section, type
,on theDelimiterfield.Click Add Columns.
Complete the following fields:
- Column Name, for example
created_at - Title, for example
Created at - format as, for example
Time
- Column Name, for example
Continue adding columns for the
field1andfield2column:Column Name, for example
field1Title, for example
Density of Westbound Carsformat as, for example
NumberColumn Name, for example
field2Title, for example
Density of Eastbound Carsformat as, for example
Number
Click Refresh.
You should see a dashboard preview.
Click Save dashboard.
Enter a message and click Save.
The dashboard is now available for others to see.
At this point in your journey, you can explore the following paths: