
Add a repository list panel to a dashboard
In this milestone, you add a dashboard panel that displays GitHub repositories for an organization. This visualization helps you monitor repository details, including owner, URL, and forks.
To create a dashboard panel for your repositories, complete the following steps:
In your existing dashboard, click Add > Visualization to add another panel.
In the data source dropdown, select your GitHub data source.
In the query builder:
- Choose Repositories from the Query Type dropdown
- Define the Owner and Repository for which you want to visualize Issues.
For example,
grafana(in both Owner and Repository).
In the visualization options on the right:
- From the Visualization dropdown, select Table.
Configure the panel settings:
- In the Panel options section, enter
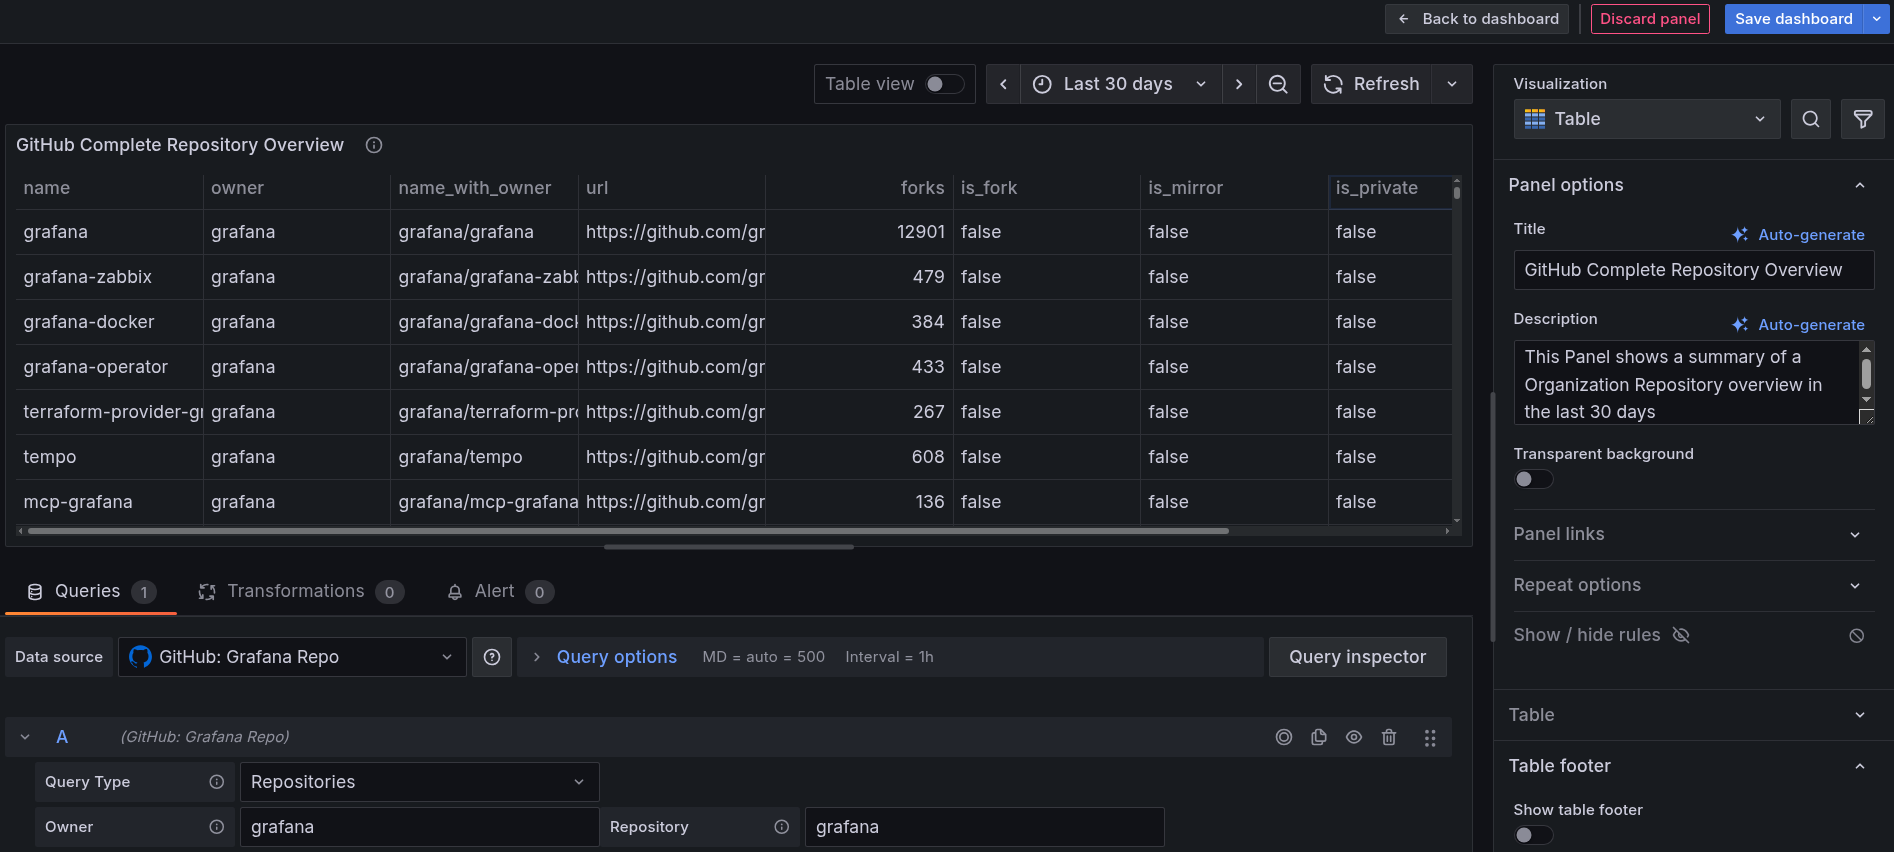
GitHub Complete Repository Overviewin the Title. - Add additional details in the Description section, explaining what the panel shows.
- In the Panel options section, enter
Set the time range:
Use the time picker toggle button in the upper right to select an appropriate range.
For example, select Last 30 days to see recent trends.
The following image shows an example of how your panel might look.
![Example GitHub data source configured successfully in Grafana Cloud]()
Click Save dashboard button on top right to save the panel to your dashboard.
Your dashboard now includes comprehensive repository details, and you can gain valuable insights into your development activity and health. You can monitor forks, creation date, and owner details.