
Add a pull requests (open/closed) panel to a dashboard
In this milestone, you create a dashboard panel that displays GitHub pull requests data, including the count of open and closed pull requests over time. This visualization helps you monitor code review processes and development workflow efficiency.
Pull requests are central to collaborative development workflows, representing proposed changes to the codebase. Tracking pull request metrics helps teams understand code review patterns, identify bottlenecks in the development process, and measure team collaboration effectiveness.
To create a dashboard panel for GitHub pull requests, complete the following steps:
In your existing dashboard, click Add > Visualization to add another panel.
In the data source dropdown, select your GitHub data source.
In the query builder:
- Choose Pull Requests from the Query Type dropdown.
- Define the Owner and Repository for which you want to visualize Issues.
For Example
grafana(in both Owner and Repository). - Choose ClosedAt from the Time Field dropdown.
In the visualization options on the right:
- From the Visualization dropdown, select Table.
Configure the panel settings:
- In the Panel options section, enter
GitHub Pull Requests Overviewin the Title. - Add additional details in the Description section, explaining what the panel shows.
- In the Panel options section, enter
Set the time range:
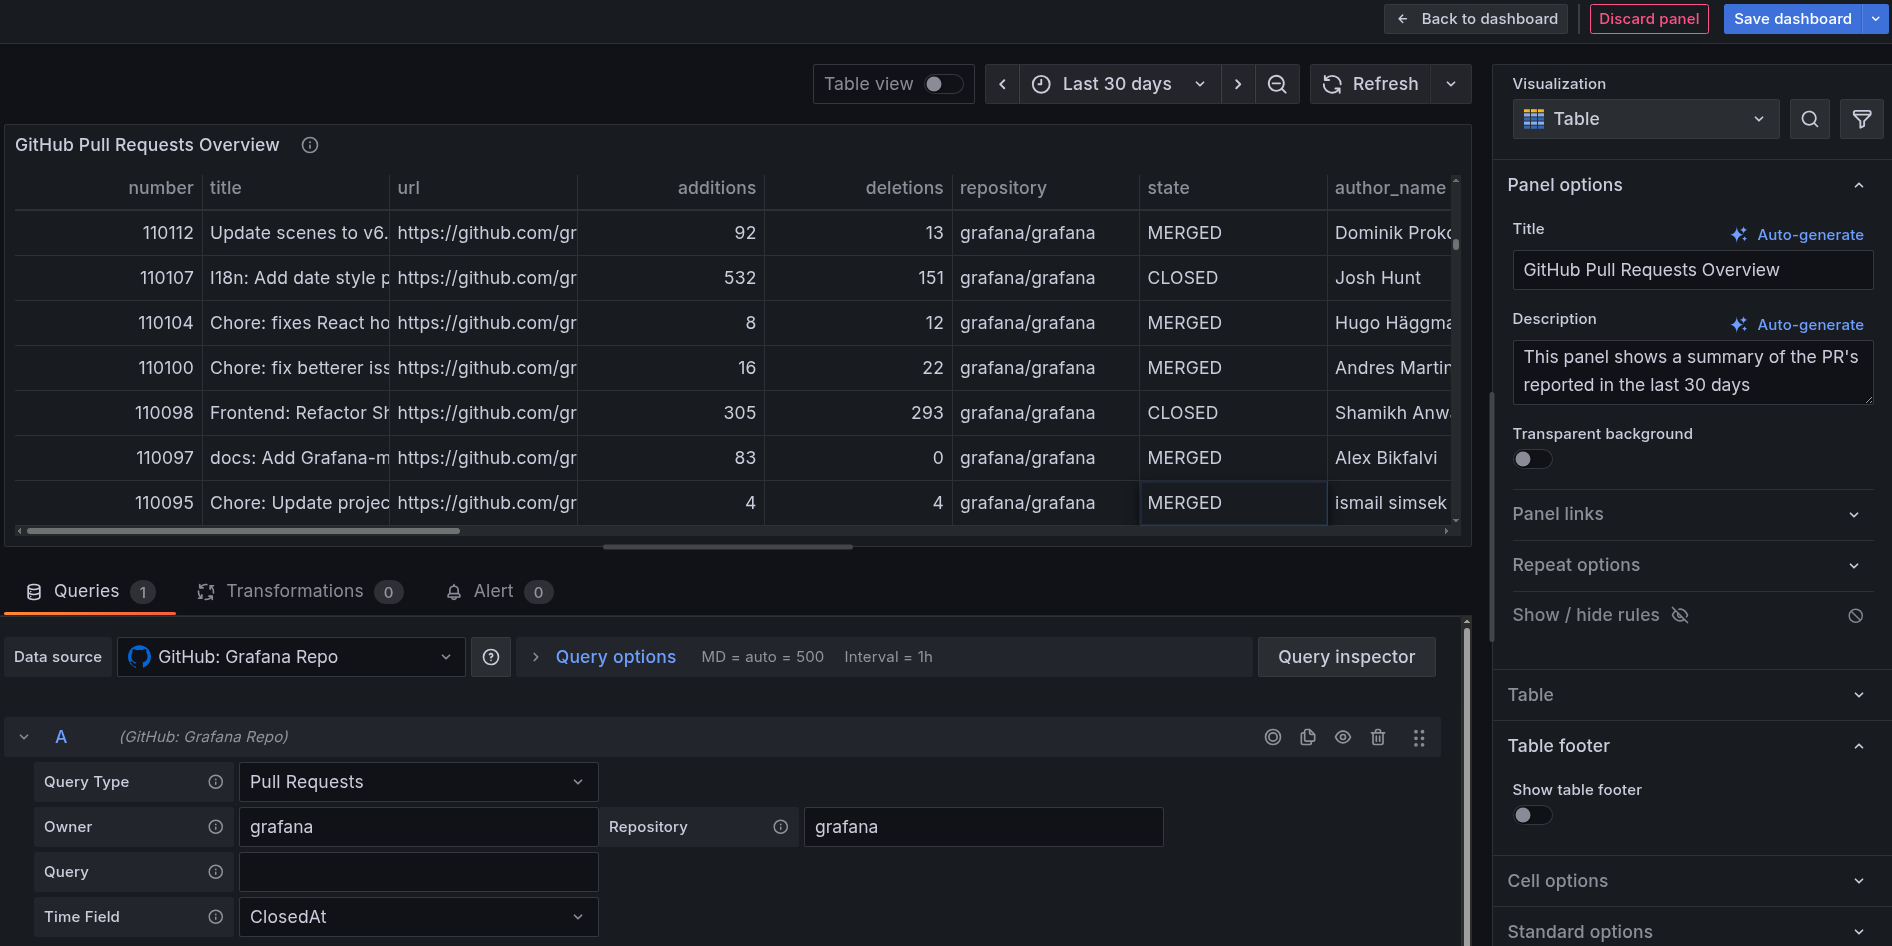
- Use the time picker toggle button in the upper right to select an appropriate range.
- For example, select Last 30 days to see recent trends.
The following image shows an example of how your panel might look.
![Example GitHub data source configured successfully in Grafana Cloud]()
Click Save dashboard button on top right to save the panel to your dashboard.
Your dashboard now includes comprehensive visualizations for both issues and pull requests, providing valuable insights into your repository’s development activity and health. You can monitor trends, identify patterns, and track team productivity over time.